Open Access in institutional Rankings
Institutional or university rankings attract a great deal of attention in science policy and the public sphere because they enable scientific institutions to be easily compared with one another on a global level. They serve various interest groups, such as political decision-makers, university managers and prospective students, as a tool for strategic decision-making, illustrating institutional excellence or choosing a place to study (Waltman et al., 2012). The methodologies on which the rankings are based are repeatedly criticised, for example because of their tendency to summarise multiple dimensions of the performance spectrum of scientific institutions into a single, often intransparent score (Diprose et al., 2023; Piro & Sivertsen, 2016; van Raan, 2005). This approach not only makes it difficult to interpret the rankings, but also fails to take sufficient account of the different tasks and priorities of the institutions (Huang et al., 2020; Waltman et al., 2012).
Five institutional rankings with Open Access as a comparative dimension could be identified: the Leiden Ranking 2024 (LR), the Leiden Ranking Open Edition 2024 (LROE), the SCImago Institutions Ranking 2024 (SIR), the Quacquarelli Symonds World University Rankings: Sustainability 2025 (QS), and the COKI OA Dashboard 2025 (COKI). All five rankings include one or more Open Access indicators and are globally oriented in terms of geographical coverage.
This page provides an overview of the characteristics of the five rankings, as well as an investigation into the extent to which the results of the rankings are comparable. This includes, among other things, a comparison of the data sources and Open Access indicators used by the rankings, as well as a review of the extent to which institutions can participate in the data collection by the ranking providers. The focus is particularly on the Open Access dimension.
Leiden Ranking
The Leiden Ranking has been produced annually by the Centre for Science and Technology Studies (CWTS) at Leiden University in the Netherlands since 2007 (Centre for Science and Technology Studies, Leiden University, n.d.-e; Waltman et al., 2012). The ranking does not offer a traditional league table where an overall score is calculated; instead, it provides various bibliometric indicators along the dimensions of scientific impact, collaboration, Open Access, and gender. The indicators are presented in both size-dependent (absolute numbers) and size-independent (relative proportions) forms to account for differences in the size of universities. The ranking also offers trend analyses over time periods and stability intervals to account for statistical uncertainties (Centre for Science and Technology Studies, Leiden University, n.d.-c, n.d.-a).
The 2024 version of the Leiden Ranking includes bibliometric data for 1,506 universities worldwide (Centre for Science and Technology Studies, Leiden University, n.d.-a). Indicators are provided for four-year time periods, with the 2024 version extending this to the period 2019–2022 (Centre for Science and Technology Studies, Leiden University, n.d.-a). The bibliographic data comes from the Web of Science, but only articles and reviews published in international scientific journals are considered (Centre for Science and Technology Studies, Leiden University, n.d.-a). The selection of universities is based on their research performance, with a minimum of 800 so-called core publications required for inclusion in the ranking. Core publications are defined as publications in international scientific journals in fields suitable for citation analysis. These publications must be in English, have at least one author, not be retracted, and appear in a core journal. Core journals are characterized by their international orientation and must be situated in a field suitable for citation analysis. The Leiden Ranking does not use data directly from universities (Centre for Science and Technology Studies, Leiden University, n.d.-a, n.d.-c).
A key feature of the Leiden Ranking is its focus on Open Access publications. Open Access indicators were added to the ranking beginning with the 2019 version (Centre for Science and Technology Studies, Leiden University, n.d.-e). To determine the Open Access status of publications, the Leiden Ranking uses OpenAlex as its data source (Centre for Science and Technology Studies, Leiden University, n.d.-a, n.d.-c).
Version: 2024
Website: https://www.leidenranking.com/
Creator: Centre for Science and Technology Studies (CWTS)
Ranking Type: University ranking
Sectors: Universities
Link to Methodology: https://traditional.leidenranking.com/Content/CWTS%20Leiden%20Ranking%202024.pdf
Data Sources: Web of Science (Publikationen), OpenAlex (Open Access Status)
Dimension with Open Access Indicators (Weight): Open Access
Open Access Indicators (Weight):
- Total number of publications by a university
- Number and proportion of open access publications by a university
- Number and proportion of gold open access publications by a university
- Number and proportion of hybrid open access publications by a university
- Number and proportion of bronze open access publications by a university
- Number and proportion of green open access publications by a university
- Number and proportion of publications by a university whose open access status is unknown
Publication-/Update-Frequency: annually
Number of Institutions: 1.506 universities
Geographic Scope: global
Presentation: multi-indicator ranking
Data Availability: Data of ranking results available under CC-BY licence: Van Eck (2024a)
Leiden Ranking Open Edition
The Leiden Ranking Open Edition has been produced annually by the Centre for Science and Technology Studies (CWTS) at Leiden University in the Netherlands since 2024 (Waltman et al., 2024). It is an approximate reproduction of the traditional Leiden Ranking using open data sources (Waltman et al., 2024) and also does not offer a traditional league table but provides various bibliometric indicators along the dimensions of scientific impact, collaboration, and Open Access. The indicators in the Open Edition are also presented in both size-dependent (absolute numbers) and size-independent (relative proportions) forms to account for differences in the size of universities. The Open Edition of the Leiden Ranking also offers trend analyses over time periods and stability intervals to account for statistical uncertainties (Centre for Science and Technology Studies, Leiden University, n.d.-b, n.d.-f).
The 2024 version of the Leiden Ranking Open Edition includes bibliometric data for 1,506 universities worldwide (Centre for Science and Technology Studies, Leiden University, n.d.-b). Indicators are provided for four-year time periods, with the 2024 version extending this to the period 2019–2022 (Centre for Science and Technology Studies, Leiden University, n.d.-b). The bibliographic data comes from OpenAlex, but only so-called core publications are considered (Centre for Science and Technology Studies, Leiden University, n.d.-b). Compared to the traditional Leiden Ranking, the Open Edition also includes publications of the type “book chapters” published in book series as core publications. Furthermore, all publications must include author affiliations and references to be considered core publications. All other criteria for core publications and core journals are identical to those of the traditional Leiden Ranking (Centre for Science and Technology Studies, Leiden University, n.d.-b).
The Leiden Ranking Open Edition also focuses on Open Access publications and offers largely the same Open Access indicators as the traditional Leiden Ranking, with the exception of indicators for publications with unknown Open Access status (Centre for Science and Technology Studies, Leiden University, n.d.-b). Additionally, the Leiden Ranking Open Edition has the distinctive feature that the publications underlying the indicators can be viewed on the web interface (van Eck, Waltman, et al., 2024).
Version: 2024
Website: https://www.open.leidenranking.com/
Creator: Centre for Science and Technology Studies (CWTS)
Ranking Type: University ranking
Sectors: Universities
Link to Methodology: https://open.leidenranking.com/Content/CWTS%20Leiden%20Ranking%20Open%20Edition%202024.pdf
Data Sources: OpenAlex
Dimension with Open Access Indicators (Weight): Open Access
Open Access Indicators (Weight):
- Total number of publications by a university
- Number and proportion of open access publications by a university
- Number and proportion of gold open access publications by a university
- Number and proportion of hybrid open access publications by a university
- Number and proportion of bronze open access publications by a university
- Number and proportion of green open access publications by a university
Publication-/Update-Frequency: annually
Number of Institutions: 1,506 universities
Geographic Scope: global
Presentation: multi-indicator ranking
Data Availability: Raw data and data of ranking results available under CC0 licence:
SCImago Institutions Ranking
The SCImago Institutions Ranking has been produced annually by the SCImago Research Group since 2009 (Rousseau et al., 2018). The ranking offers a traditional league table of scientific and research-related institutions based on a composite indicator on a scale between 0 and 100. The composite indicator combines evaluations along three dimensions: research, innovation, and societal impact. The composite indicator is derived from a weighted combination of metrics along these dimensions, using both size-dependent and size-independent metrics. For each institution, the ranking also provides a series of graphs, for example, on rank development over time, comparisons at national, regional, or global levels, or comparisons with similar institutions based on publication profiles (SCImago Research Group, n.d.-a).
The 2025 version of the SCImago Institutions Ranking includes data for 9,756 institutions worldwide (SCImago Research Group, n.d.-b). The composite indicator is provided annually for a five-year period ending two years before the ranking’s publication, meaning for the 2025 version, the period is 2019–2023. The bibliographic data comes from Scopus. The selection of institutions is based on their publication performance. In the last year of the period considered, institutions must have published at least 100 Scopus-indexed publications to be included in the ranking. Furthermore, at least 75% of an institution’s total publication volume must consist of citable documents. For the SCImago Institutions Ranking, citable documents include the publication types articles, book chapters, conference contributions, reviews, and short surveys (SCImago Research Group, n.d.-a).
Within the research dimension, which accounts for 50% of the composite indicator, an Open Access indicator was added to the ranking beginning with the 2019 version. This indicator accounts for 2% of the research dimension and measures the percentage of documents published in Open Access journals or indexed in Unpaywall. To determine the Open Access status of publications, the SCImago Institutions Ranking uses Unpaywall as its data source (SCImago Research Group, n.d.-a).
Version: 2025
Website: https://www.scimagoir.com/
Creator: SCImago Research Group
Ranking Type: Institutional ranking
Sectors: Government agencies, universities, companies, health organisations, non-profit organisations
Link to Methodology: https://www.scimagoir.com/methodology.php
Data Sources: Scopus (publications), Unpaywall (Open Access status)
Dimension with Open Access Indicators (Weight): Research (50%)
Open Access Indicators (Weight): Share of documents published in open access journals or indexed in Unpaywall (2%)
Publication-/Update-Frequency: annually
Number of Institutions: 9,756 universities and research-related institutions
Geographic Scope: global
Presentation: league table
Data Availability: Data of ranking results available via the ranking website, no licence information provided: https://www.scimagoir.com/rankings.php
QS Sustainability Ranking
The QS World University Rankings: Sustainability has been produced annually by Quacquarelli Symonds since 2023, following a pilot version released in 2022 (Quacquarelli Symonds, 2024). The ranking offers a traditional league table of universities based on a composite indicator for individual categories and subcategories (Lenses), as well as an overall score. The ranking evaluates institutions along three dimensions: Environmental Impact, Social Impact, and Governance.
The 2025 version of the QS World University Rankings: Sustainability includes data for 1,744 universities worldwide (Quacquarelli Symonds, 2024). The bibliographic data comes from Scopus and covers a five-year period (Quacquarelli Symonds, n.d.-c). Only the publication types articles, reviews, conference contributions, books, book chapters, articles in press, and business articles are considered (Quacquarelli Symonds, n.d.-d, n.d.-e). Institutions are included in the QS World University Rankings: Sustainability only if they meet eligibility criteria for inclusion in at least one of the rankings QS World University Rankings, QS Rankings by Region, or QS Rankings by Subject and also achieve a non-zero score for specific indicators within the Environmental Impact and Social Impact dimensions (Quacquarelli Symonds, n.d.-f).
Within the Governance dimension, which accounts for 10% of the overall score, an Open Access publications indicator is included. This indicator accounts for 1% of the Governance dimension and measures the proportion of Open Access publications in the institution’s total publication volume. The proportion is calculated individually for the six fields considered and aggregated into a weighted sum. Gold and hybrid publications are weighted more heavily in the calculation than green Open Access publications. To determine the Open Access status of publications, the QS World University Rankings: Sustainability uses Unpaywall as its data source (Quacquarelli Symonds, n.d.-a).
Version: 2025
Website: https://www.topuniversities.com/sustainability-rankings
Creator: Quacquarelli Symonds Ltd.
Ranking Type: University ranking
Sectors: Universities
Link to Methodology: https://support.qs.com/hc/en-gb/articles/8551503200668-QS-World-University-Rankings-Sustainability
Data Sources: Scopus (publications), Unpaywall (Open Access status)
Dimension with Open Access Indicators (Weight): Governance (10%)
Open Access Indicators (Weight): The proportion of an institution’s total research output that is available as open access according to Unpaywall (1%)
Publication-/Update-Frequency: annually
Number of Institutions: 1,744 universities
Geographic Scope: global
Presentation: league table
Data Availability: Data of ranking results available on the ranking website after registration, no licence information provided: https://www.topuniversities.com/sustainability-rankings
COKI OA Dashboard
The COKI Open Access Dashboard has been produced by the Curtin Open Knowledge Initiative since 2022 (Curtin Open Knowledge Initiative, 2022; Curtin Open Knowledge Initiative & Wilson, 2022). The dashboard is not a traditional ranking but allows institutions and countries to be sorted by Open Access percentage and total as well as Open Access publication volumes (Curtin Open Knowledge Initiative, 2022). The dashboard also shows, for individual countries and institutions, the platforms through which Open Access publications are made available, both aggregated over the entire publication period and broken down by individual publication years (Curtin Open Knowledge Initiative, 2022).
The version of the COKI Open Access Dashboard from August 18, 2025, includes data for 227 countries and 56,187 institutions worldwide (Curtin Open Knowledge Initiative, n.d.-c). The bibliographic data comes from multiple open data sources and covers the publication period 2000–2024, with Crossref being used primarily for publication identification (Curtin Open Knowledge Initiative, n.d.-c, n.d.-d). The selection of publication types is less restrictive compared to the other rankings, with only specific types such as datasets, databases, components, report components, peer reviews, funding acknowledgments, conference proceedings, journal issues, report series, book catalogs, and publications without a specified type being excluded (Curtin Open Knowledge Initiative, n.d.-c). Institutions must have at least 50 publications to be included in the COKI Open Access Dashboard, unless the institutions were already included in the dataset when it was based on the Microsoft Academic Graph dataset (Curtin Open Knowledge Initiative, n.d.-c).
The COKI Open Access Dashboard focuses exclusively on the Open Access activities of institutions and countries. While the list view primarily displays the absolute number and percentage of Open Access publications, detailed views for individual institutions and countries provide more differentiated breakdowns of publication activities and locations, supplemented by visualizations (Curtin Open Knowledge Initiative, n.d.-d). To determine the Open Access status of publications, the COKI Open Access Dashboard uses Unpaywall as its data source (Curtin Open Knowledge Initiative, n.d.-c).
Version: 18.08.2025
Website: https://open.coki.ac/
Creator: Curtin Open Knowledge Initiative
Ranking Type: Country and institutional ranking
Sectors: Funding organisations, government agencies, universities, companies, health organisations, non-profit organisations, infrastructure organisations, archives, others
Link to Methodology: https://open.coki.ac/how/
Data Sources: Crossref (publications), Unpaywall (Open Access status)
Dimension with Open Access Indicators (Weight): –
Open Access Indicators (Weight):
- Percentage of open access publications
- Total number of publications
- Total number of open access publications
- Percentage of articles accessible via open access through the publisher
- Percentage of articles accessible via open access through other platforms (repositories, preprint servers, etc.)
- Percentage of articles that are accessible via both the publisher and other platforms
- Percentage of closed articles
- Percentage of articles published in an open access journal
- Percentage of articles published in a hybrid journal
- Percentage of articles that are open access via the publisher without reuse rights
- Percentage of articles that are open access via institutional repositories
- Percentage of articles that are open access via preprint servers
- Percentage of articles that are open access via subject repositories
- Percentage of articles that are open access via other public repositories
- Percentage of articles that are open access via other websites or portals
Publication-/Update-Frequency: regularly
Number of Institutions: 56,187 institutions
Geographic Scope: global
Presentation: Multi-indicator dashboard
Data Availability: Data of ranking results available via the ranking website under CC-BY licence: https://open.coki.ac/data/
Comparability of Ranking Results
To assess how comparable the results of the selected rankings are, the following sections focus on examining the data sources used by the rankings, the Open Access indicators and their weighting, the number of institutions represented in all rankings, the geographical distribution of institutions across countries and world regions, and the possibility of institutional participation in the data collection process of the ranking providers.
The aim is to identify how the individual ranking systems differ and what implications this may have for the use of a particular ranking in Open Access monitoring activities or strategic decision-making.
Data Sources
This section examines the data sources used by the five rankings, focusing on two categories of data sources: those used for collecting bibliographic data and those used for determining the Open Access status. Differences in the coverage, completeness, and methodology of these data sources can lead to discrepancies in the calculation of metrics and thus limit the comparability of the results across different rankings. Additionally, it is investigated whether disciplinary differences arise between the rankings due to the data sources used.
Bibliographic Data Sources
| Ranking | Web of Science | Scopus | OpenAlex | Crossref |
|---|---|---|---|---|
| Leiden Ranking | x | |||
| Leiden Ranking Open Edition | x | |||
| SCImago Institutions Ranking | x | |||
| QS Sustainability Ranking | x | |||
| COKI OA Dashboard | x |
Open Access Data Sources
| Ranking | Unpaywall | OpenAlex |
|---|---|---|
| Leiden Ranking | x | |
| Leiden Ranking Open Edition | x | |
| SCImago Institutions Ranking | x | |
| QS Sustainability Ranking | x | |
| COKI OA Dashboard | x |
Disciplinary Differences
Open Access Indicators
Institutional Overlap
To determine the institutional overlaps between the rankings, the available results data from the rankings were first downloaded1. In addition to the names and locations (country information, sometimes also region and sub-region) of all institutions, the data from both versions of the Leiden Ranking and the COKI OA Dashboard also include identifiers from the Research Organization Registry (ROR). Furthermore, the data from the COKI OA Dashboard and the SCImago Institutions Ranking include sector classifications for all institutions represented in the rankings.
To uniquely assign ROR IDs to identical institutions across the rankings, the ROR dataset (version 1.69) (Research Organization Registry, 2025) was downloaded in full. A machine-based matching process was then performed for both the SCImago Institutions Ranking and the QS Sustainability Ranking using institutional names and country information. For the QS data, which included entries for a total of 1,743 institutions, ROR IDs could be assigned to 1,204 institutions through machine-based matching. For the remaining 539 institutions, manual assignment of ROR IDs was performed, although no assignment could be made for 7 institutions. Therefore, only 1,736 institutions from the QS Sustainability Ranking could be considered for the analysis of institutional overlaps.
Assigning ROR IDs to the 9,755 institutions included in the SCImago Institutions Ranking proved more challenging. Through machine-based matching using institutional names and country information, ROR IDs could only be assigned to 4,714 institutions. In part, this may be due to the fact that the SCImago Institutions Ranking also lists institutions classified as multinational (SCImago Research Group, n.d.-a). This seems to particularly affect companies that operate globally, such as Google. While ROR also provides IDs for companies (see Google), it appears to assign clear country classifications. However, the greater difficulty for machine-based matching likely stems from differences in name spelling between the SCImago Institutions Ranking and ROR2. To increase the coverage of ROR IDs for the SCImago Institutions Ranking, a fuzzy matching approach was tested, which also considered alternative name forms and acronyms from the ROR dataset. However, the result was not sufficiently accurate and would have required extensive data cleaning. Overall, this constitutes a significant limitation for the usability of the SCImago dataset for a global analysis of institutional overlaps.
Due to the difficulties in assigning ROR IDs, it was decided to limit the analysis of institutional overlaps to institutions from Germany. In the QS Sustainability Ranking dataset, a total of 50 institutions from Germany could be identified, all of which could be assigned ROR IDs. In the SCImago Institutions Ranking dataset, a total of 364 institutions from Germany could be identified, of which 342 could not be assigned ROR IDs through machine-based matching. Therefore, manual assignment of ROR IDs was performed, although no assignment could be made for 6 of the 342 institutions. For the analysis of institutional overlaps among German institutions, 385 institutions from the SCImago Institutions Ranking could thus be considered.
Figure 2 quantitatively represents the institutional overlaps of German institutions with ROR IDs in the five ranking systems. The figure only includes institutions that could be assigned ROR IDs.
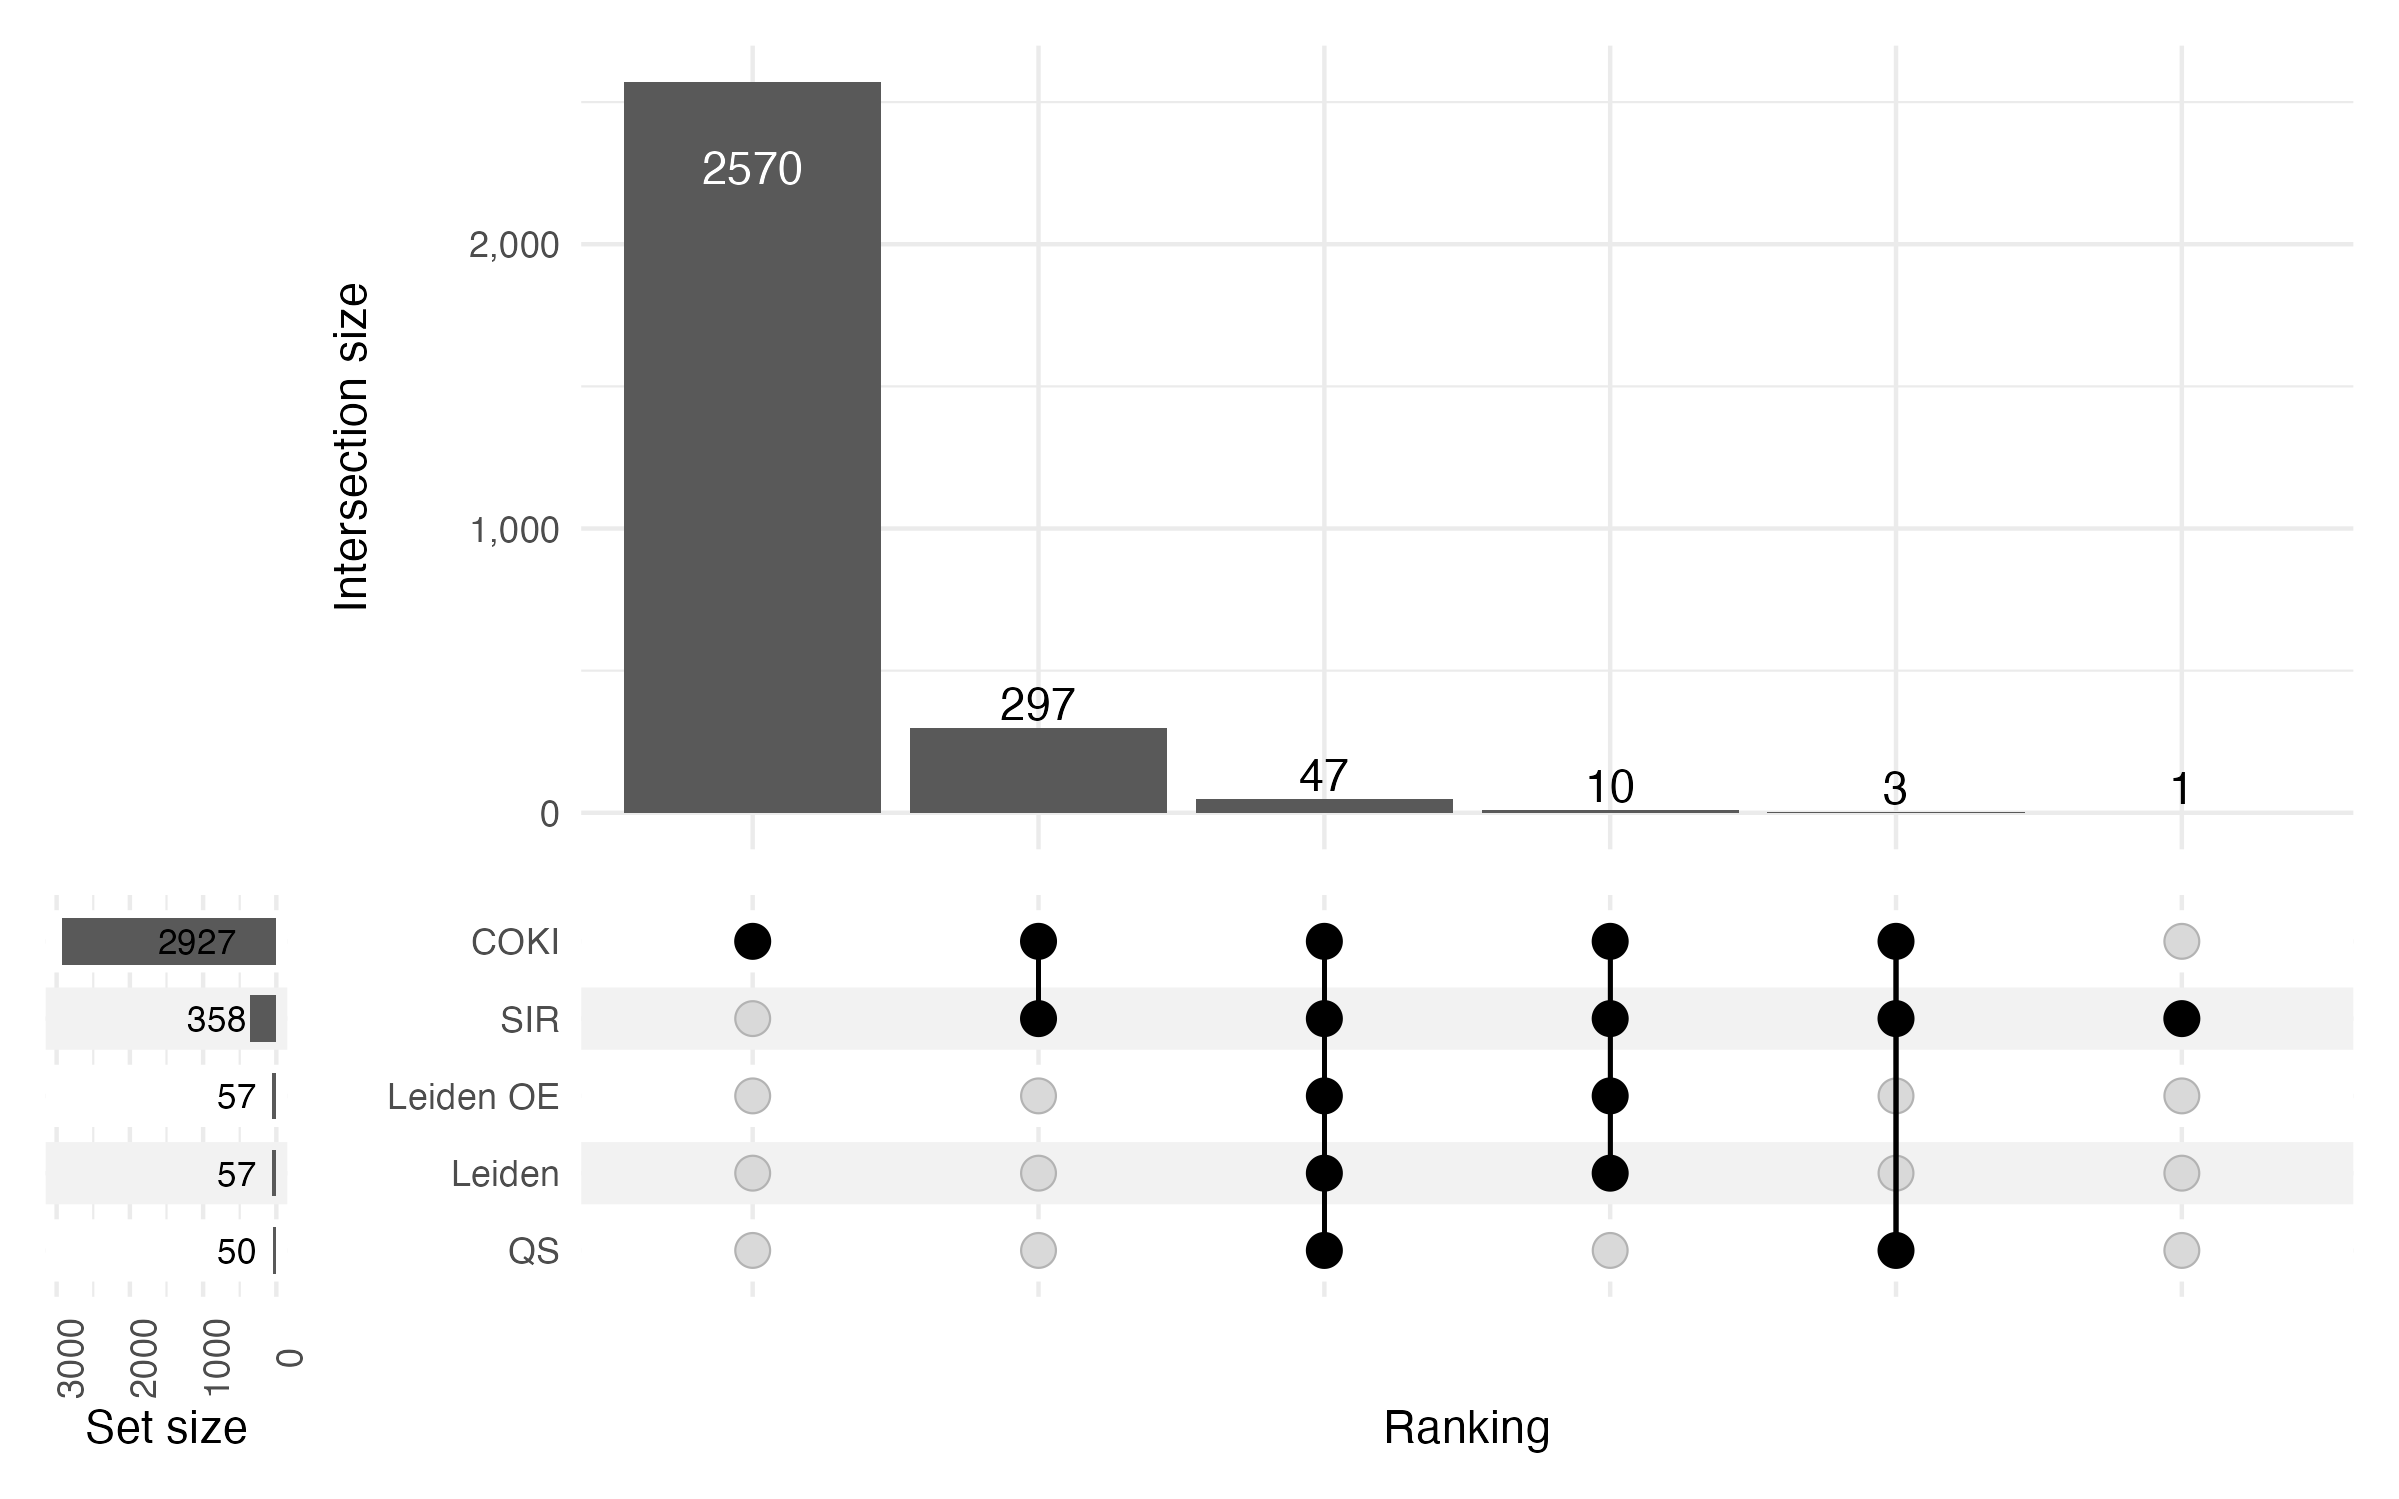
Overall, 2.928 unique institutions from Germany could be identified across all ranking systems. From Figure 2, it is evident that the COKI OA Dashboard clearly includes more German institutions than all other ranking systems, both in total (2.927 institutions, 99,97 %) and in terms of the number of institutions that are not represented in any other ranking system (2.570 institutions, 87,77 %). This could be particularly due to the fact that the COKI OA Dashboard covers a relatively long publication period (2000–2024) and also includes institutions from multiple sectors, as well as institutions with a relatively small publication volume of at least 50 publications (Curtin Open Knowledge Initiative, n.d.-c, n.d.-b).
Figure 2 also shows that of the 358 institutions from the SCImago Institutions Ranking, 1 institution (0,03 %) is not represented in any other ranking. In contrast, all institutions from both versions of the Leiden Ranking and the QS Sustainability Ranking are also represented in at least one other ranking. Overall, only 47 institutions (1,61 %) are represented in all five ranking systems.
While the QS Sustainability Ranking and both versions of the Leiden Ranking only include universities in their rankings, the COKI OA Dashboard and the SCImago Institutions Ranking also include institutions from other sectors. Universities in the COKI dataset are classified with the institution type Education, while in the SCImago Institutions Ranking dataset, the sector Universities is assigned to universities. To further investigate the institutional overlaps of German universities between the five ranking systems, a sector column was added to the merged dataset of all ranking systems. For institutions represented in both versions of the Leiden Ranking or in the QS Sustainability Ranking, the sector classification Universities was added. For institutions represented in the SCImago Institutions Ranking or the COKI OA Dashboard, the original classification was retained. The dataset was then filtered to include only institutions assigned to the Universities or Education sectors.
Figure 3 represents the institutional overlaps of German universities between the rankings. The figure also only includes institutions that could be assigned ROR IDs.
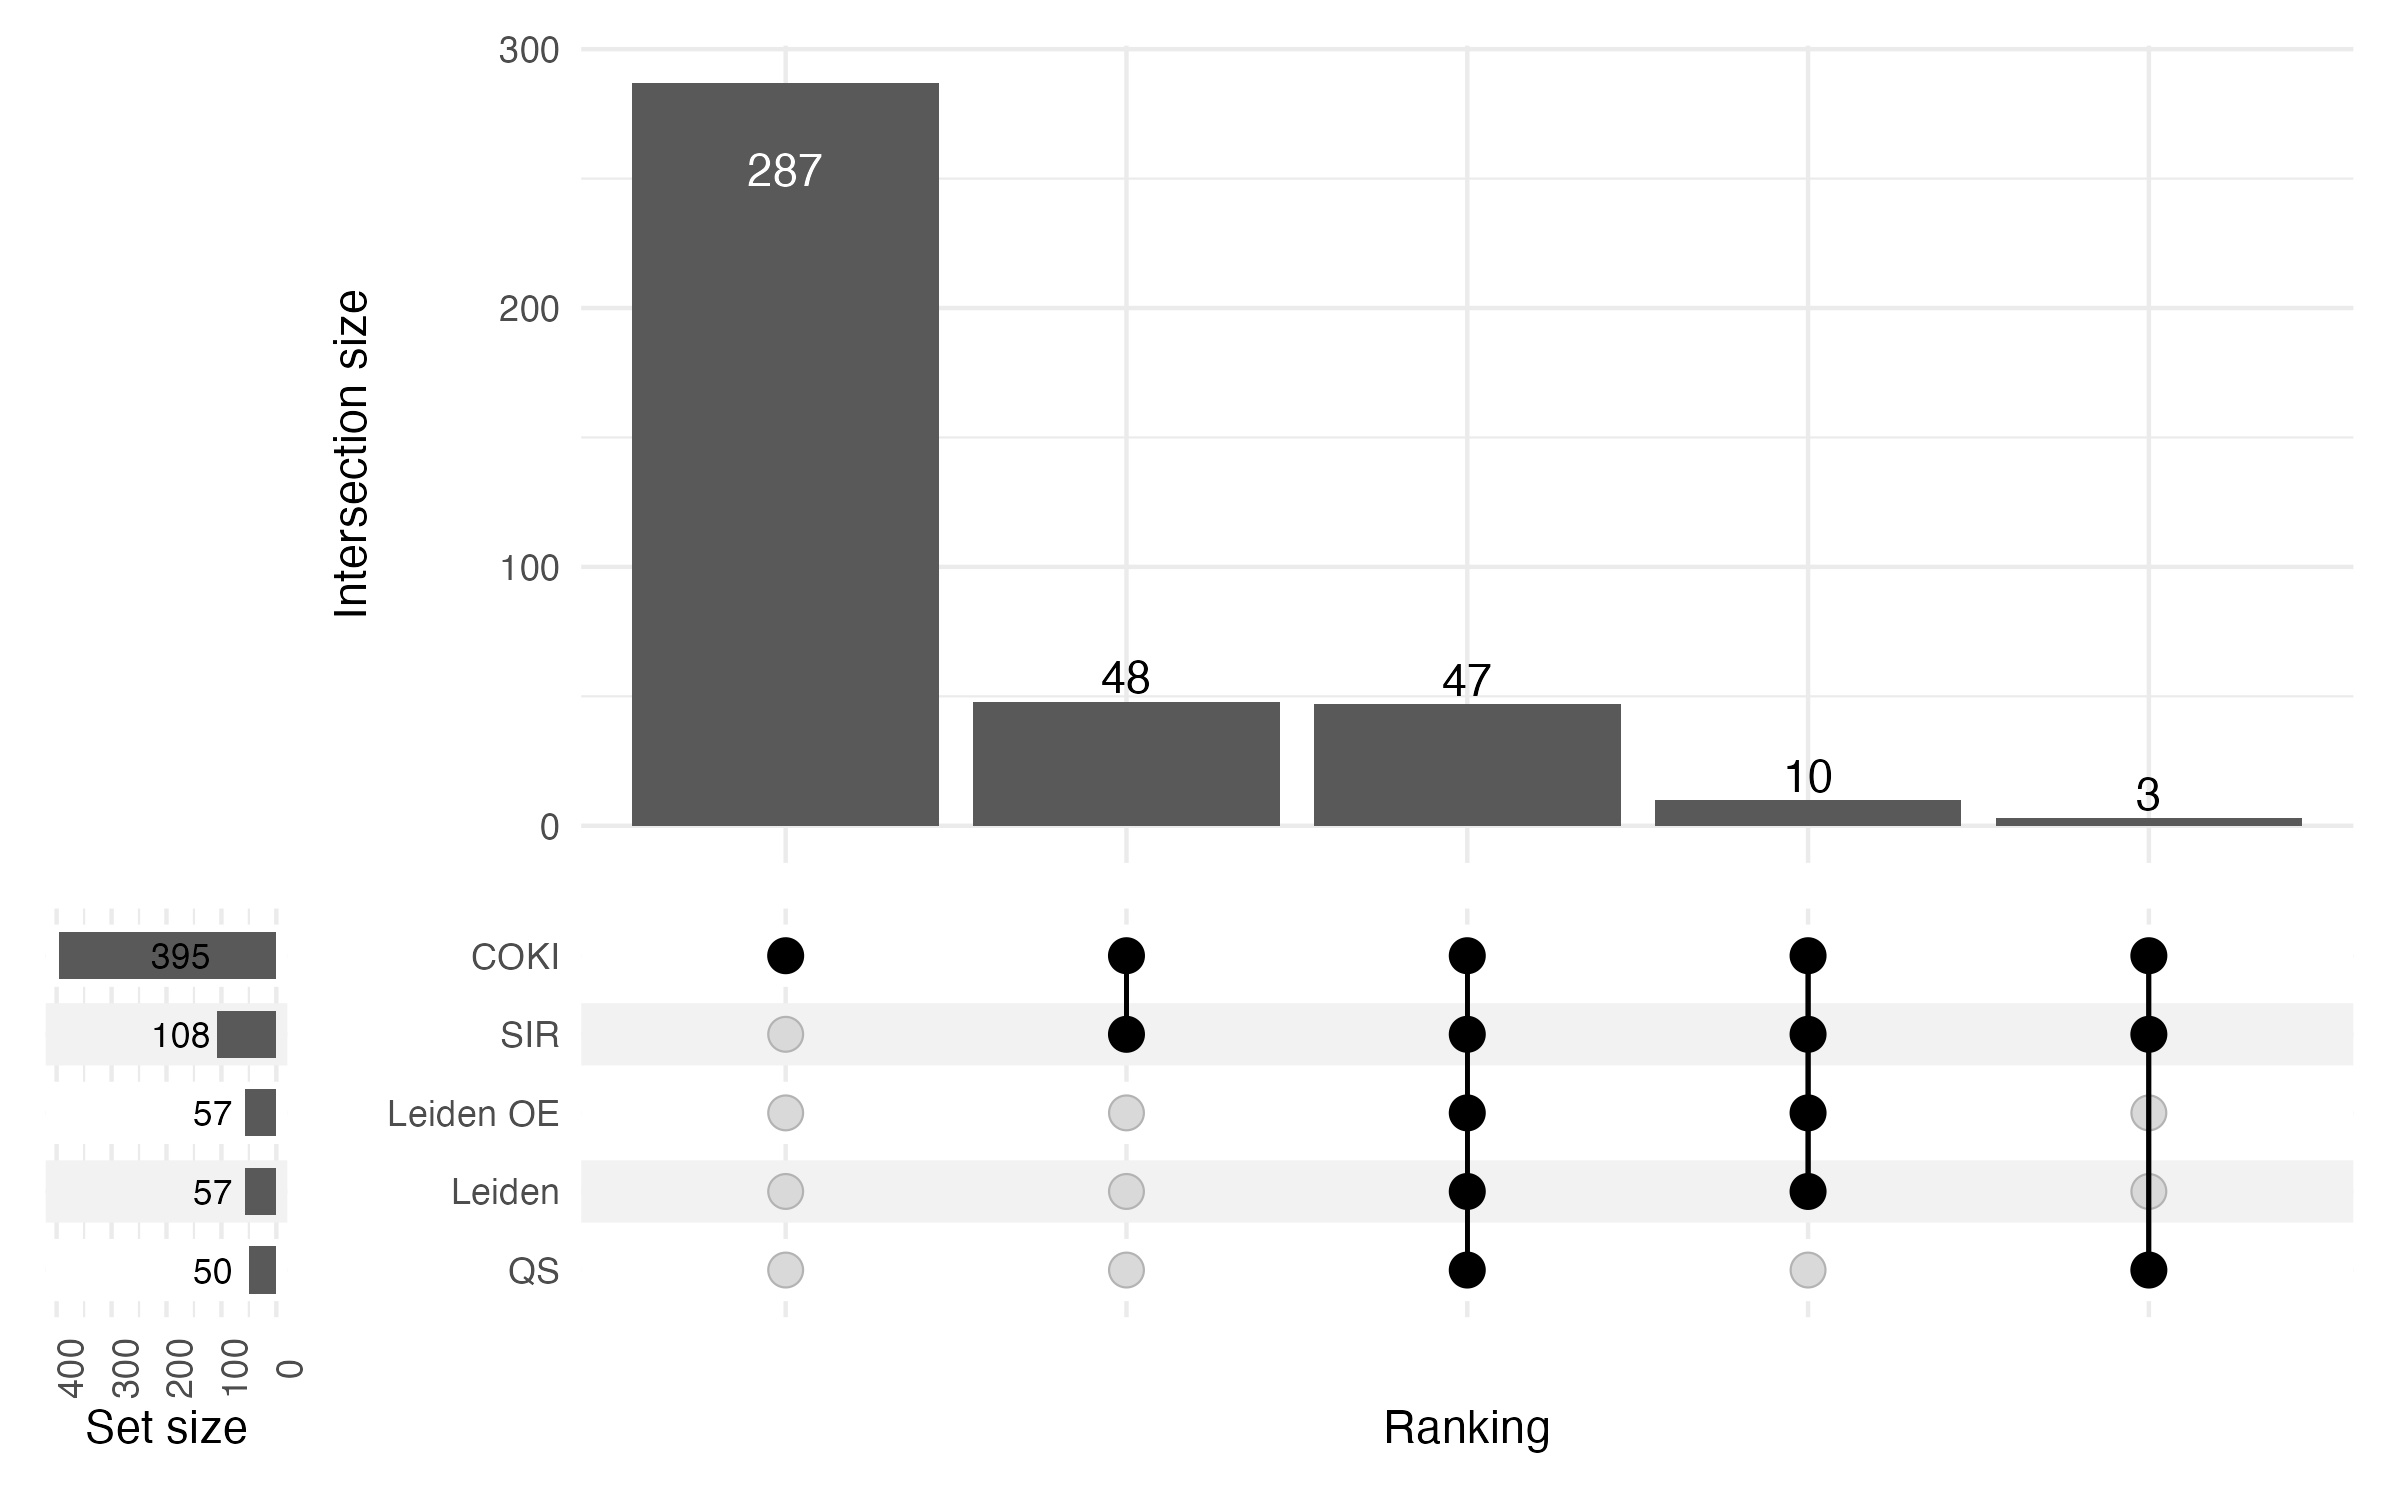
Overall, 395 different German universities could be identified across all ranking systems. From Figure 3, it is evident that the COKI OA Dashboard also includes more German universities than all other ranking systems, both in total (395 institutions, 100 %) and in terms of the number of institutions that are not represented in any other ranking system (287 institutions, 72,66 %). According to the German Federal Statistical Office, a total of 422 German universities were counted in the 2024/2025 winter semester (Statistisches Bundesamt, 2025). Accordingly, the COKI OA Dashboard currently represents 93,6 % of all German universities. It is also the only ranking system that includes universities not represented in any other ranking. The absolute number of German universities represented in all five ranking systems remains the same as the absolute number of all German institutions represented in all five ranking systems.
The COKI OA Dashboard and the SCImago Institutions Ranking are the only two of the analyzed ranking systems that do not exclusively include universities. With regard to Germany, of the total 2.927 German institutions represented in the COKI OA Dashboard, 13,5 % are German universities. In comparison, of the total 358 German institutions represented in the SCImago Institutions Ranking, 30,17 % are German universities. For both ranking systems, it can thus be concluded that the majority of represented institutions, at least with regard to Germany, are assigned to other sectors.
Geographical Distribution
Figures 4 and 53 show the geographical distribution of institutions in terms of the countries and world regions in which they are located. While all five rankings have a global orientation, the figures aim to visualize whether there are differences in the geographical distribution between the rankings. To ensure better comparability, the institutions in all ranking systems were limited to those assigned to the university sector (Universities, Education).
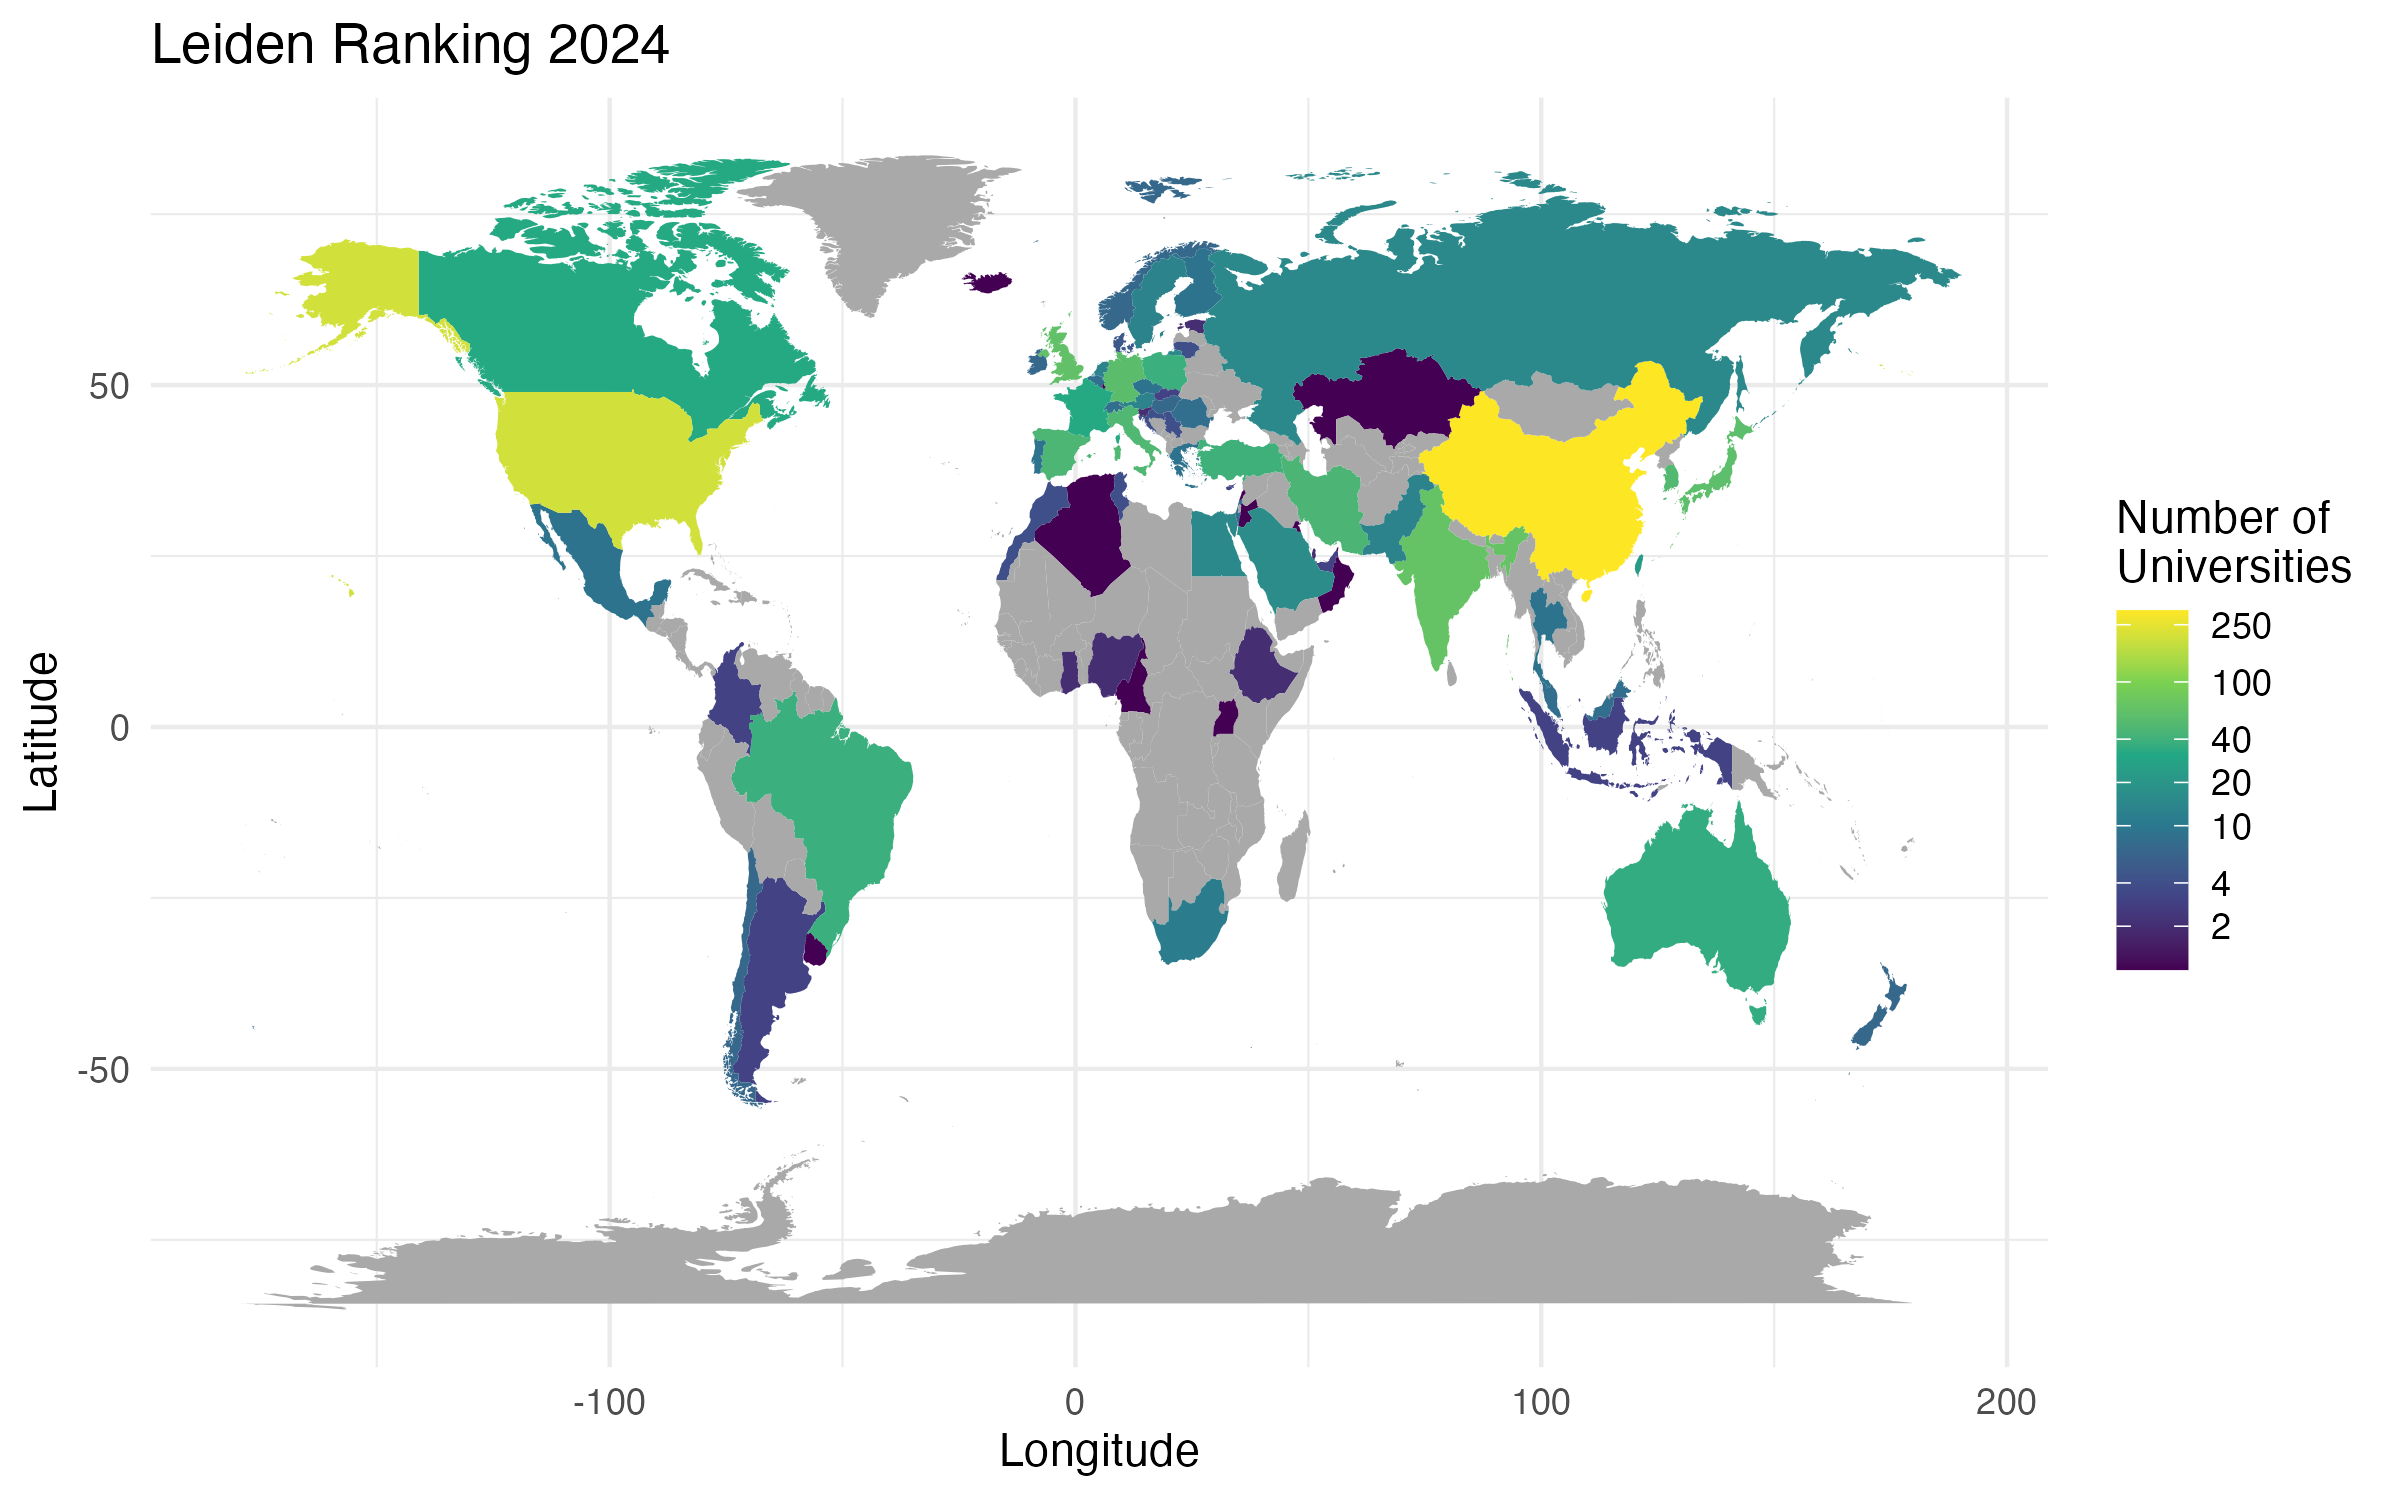
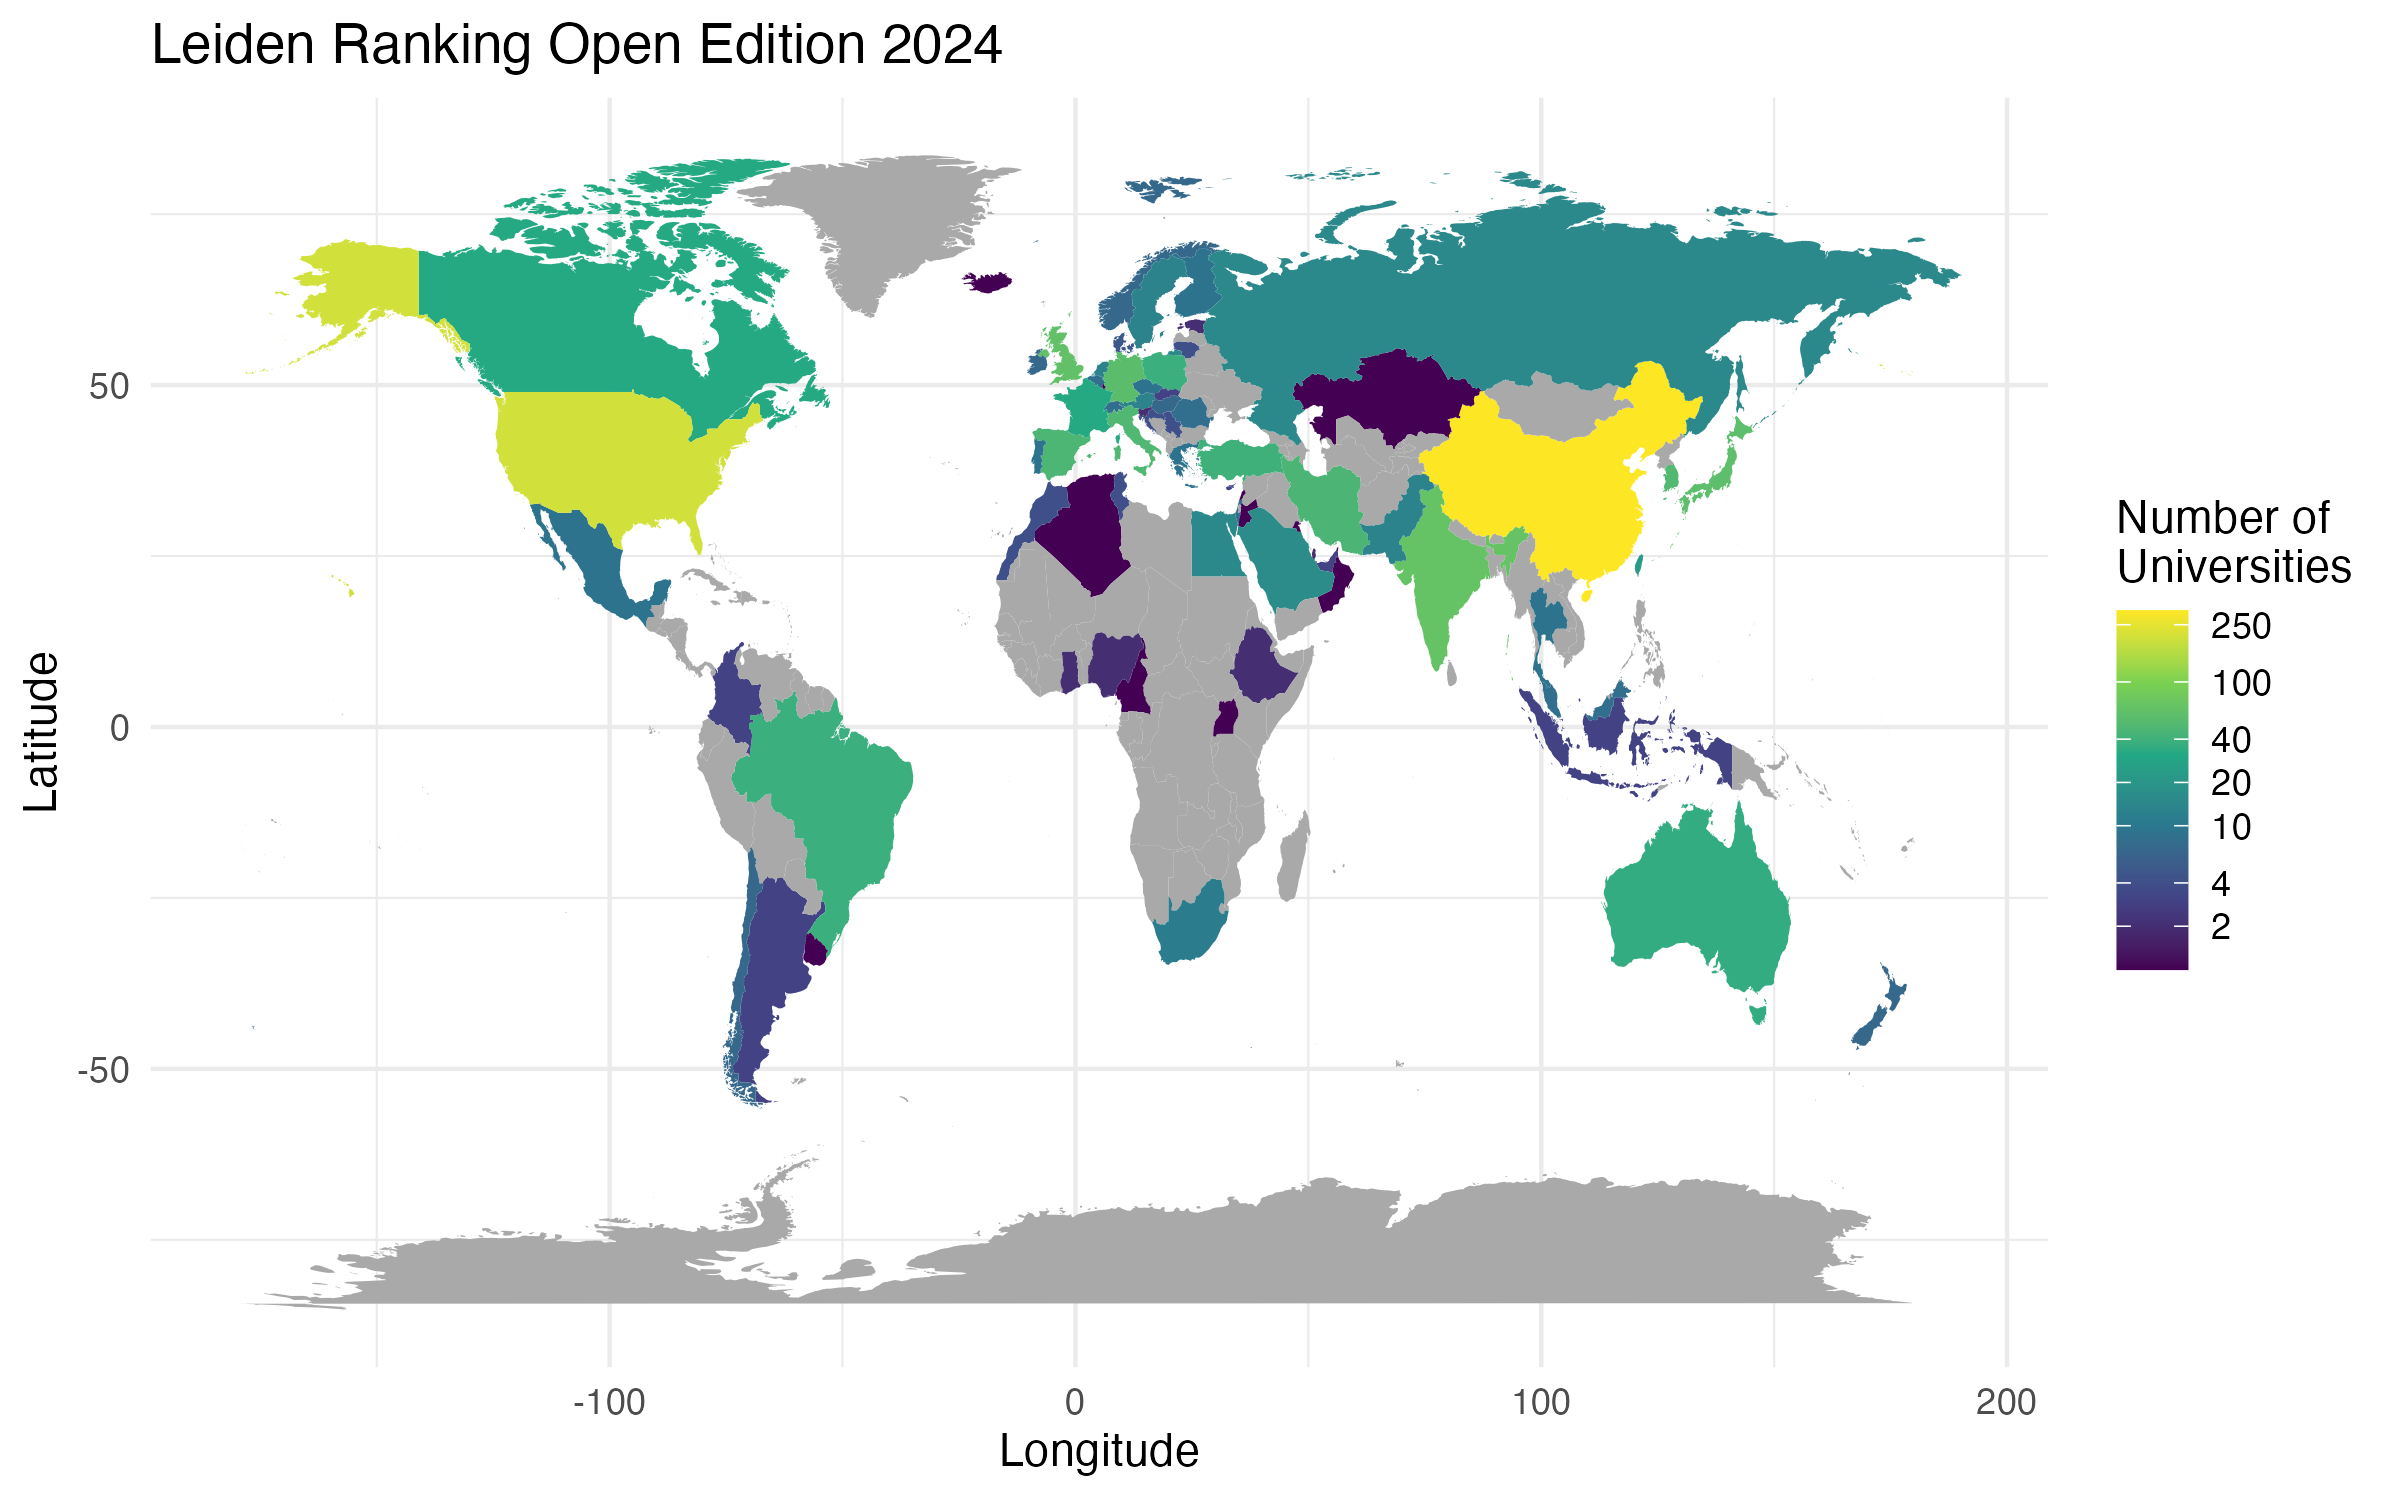
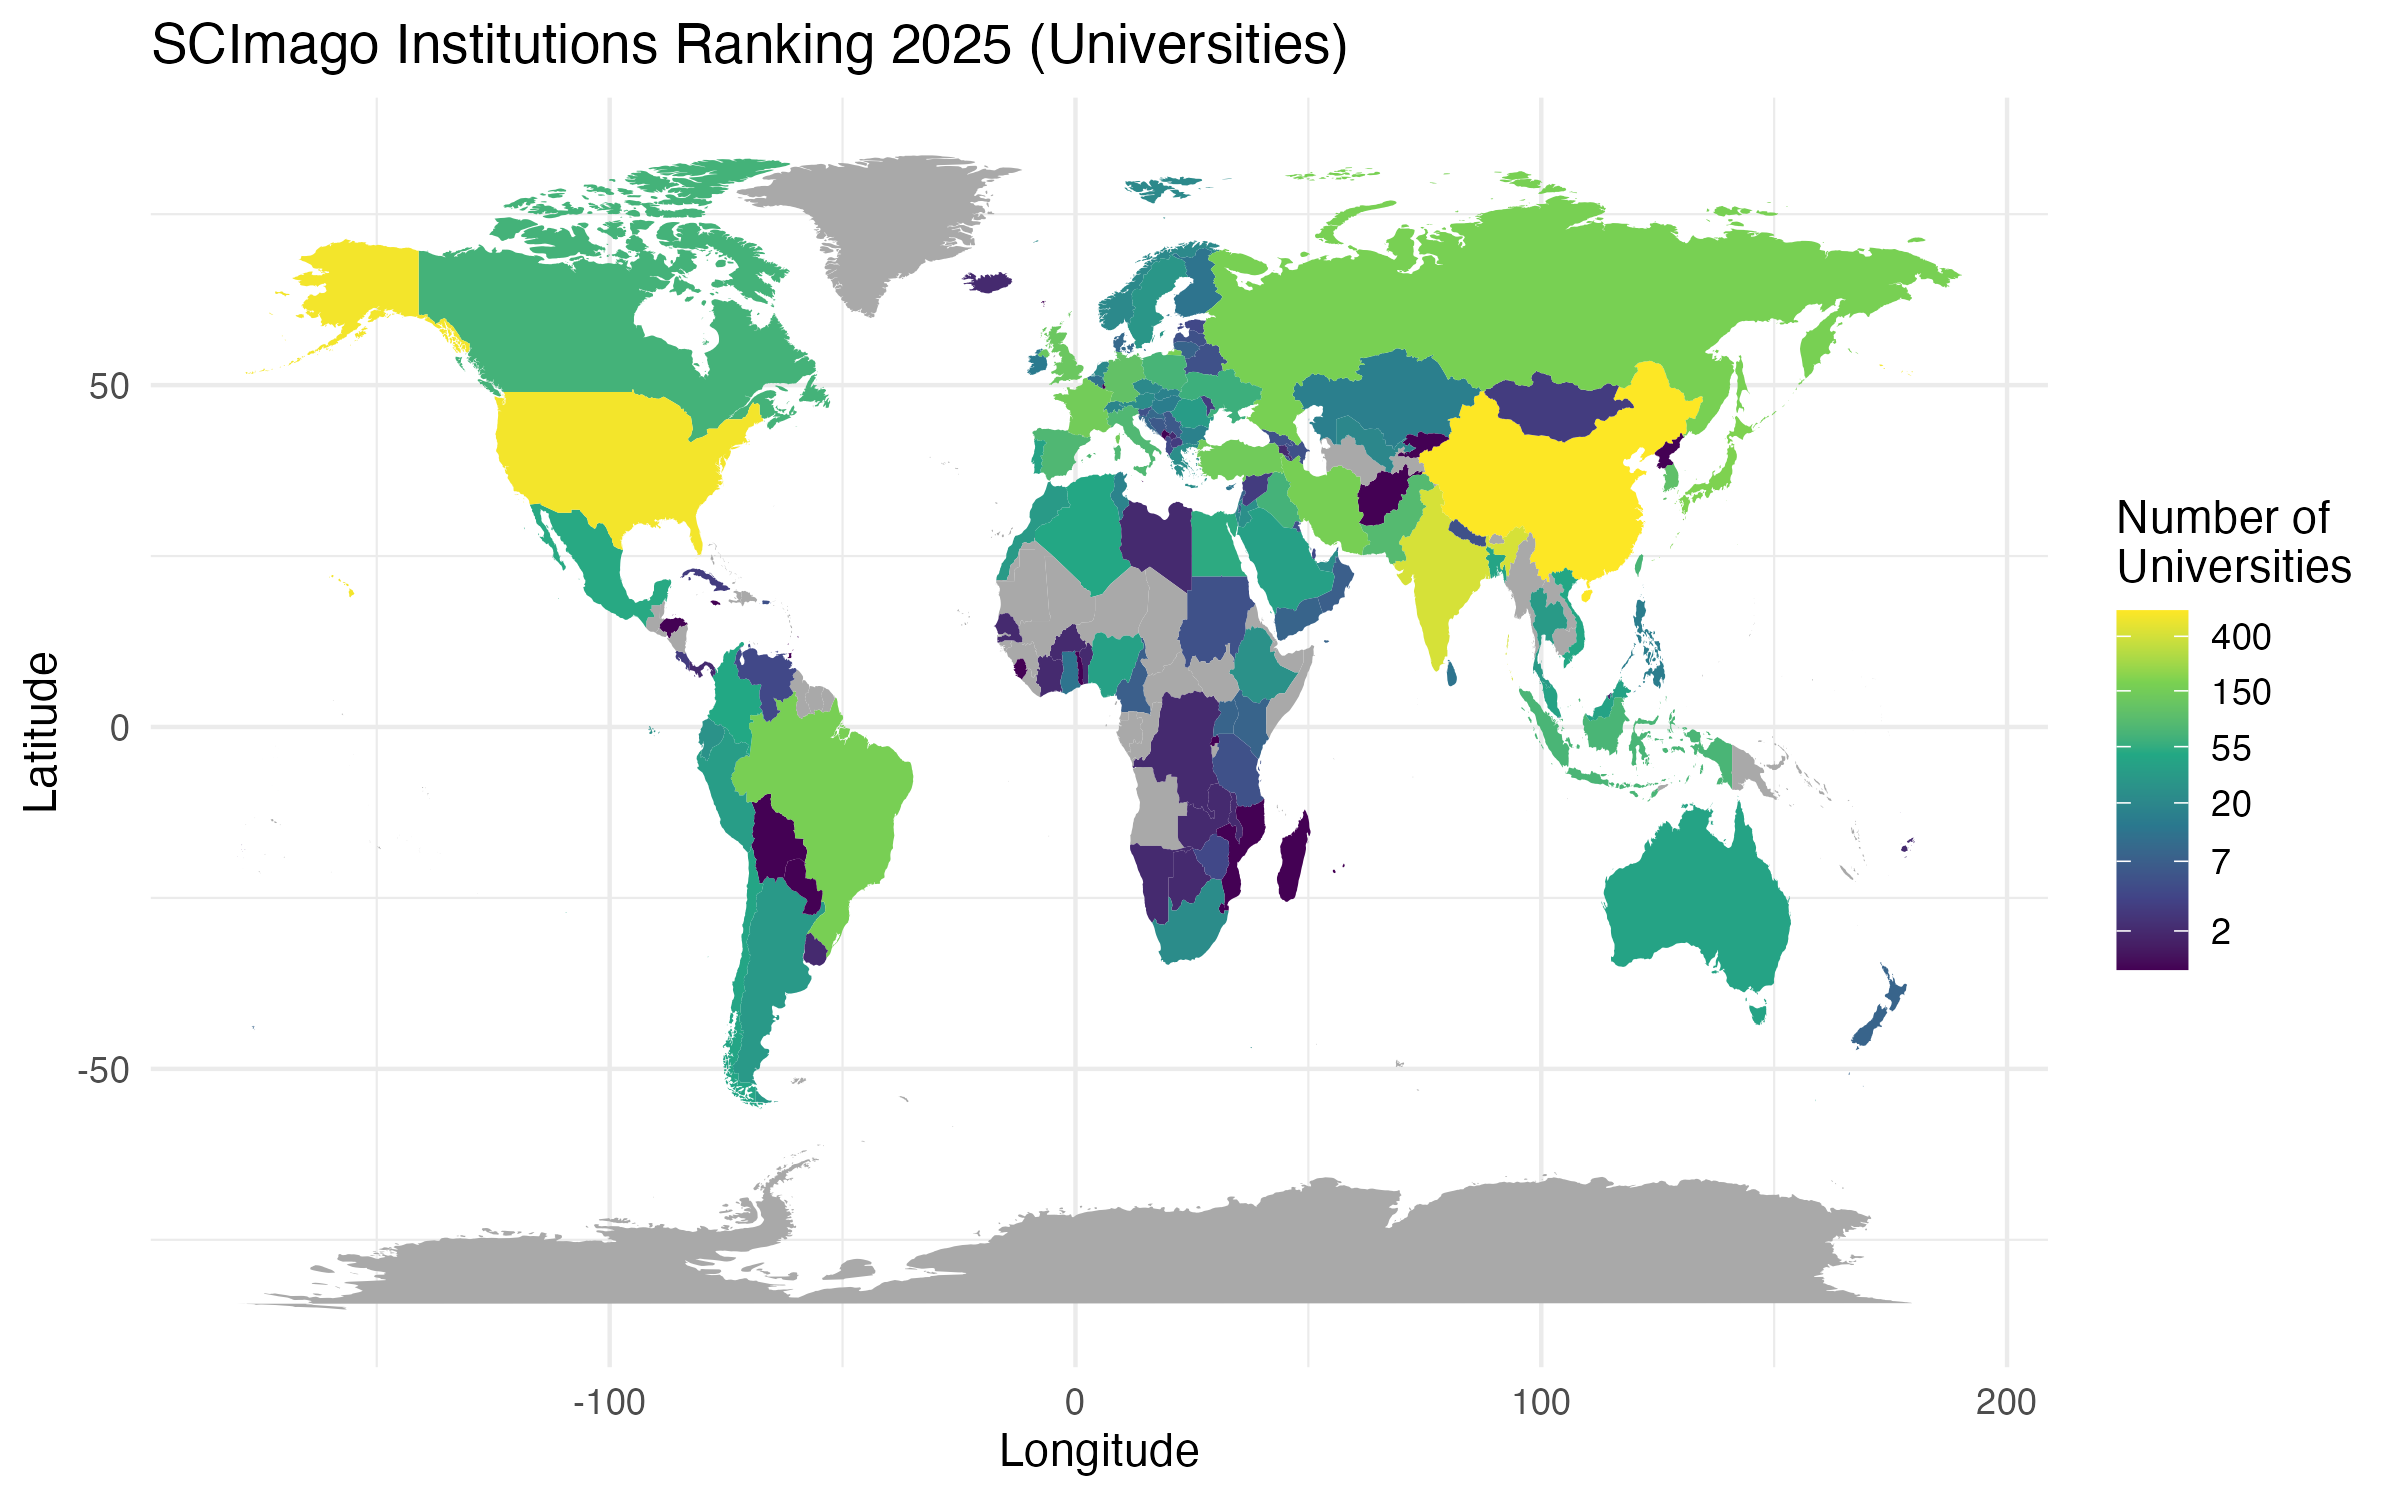
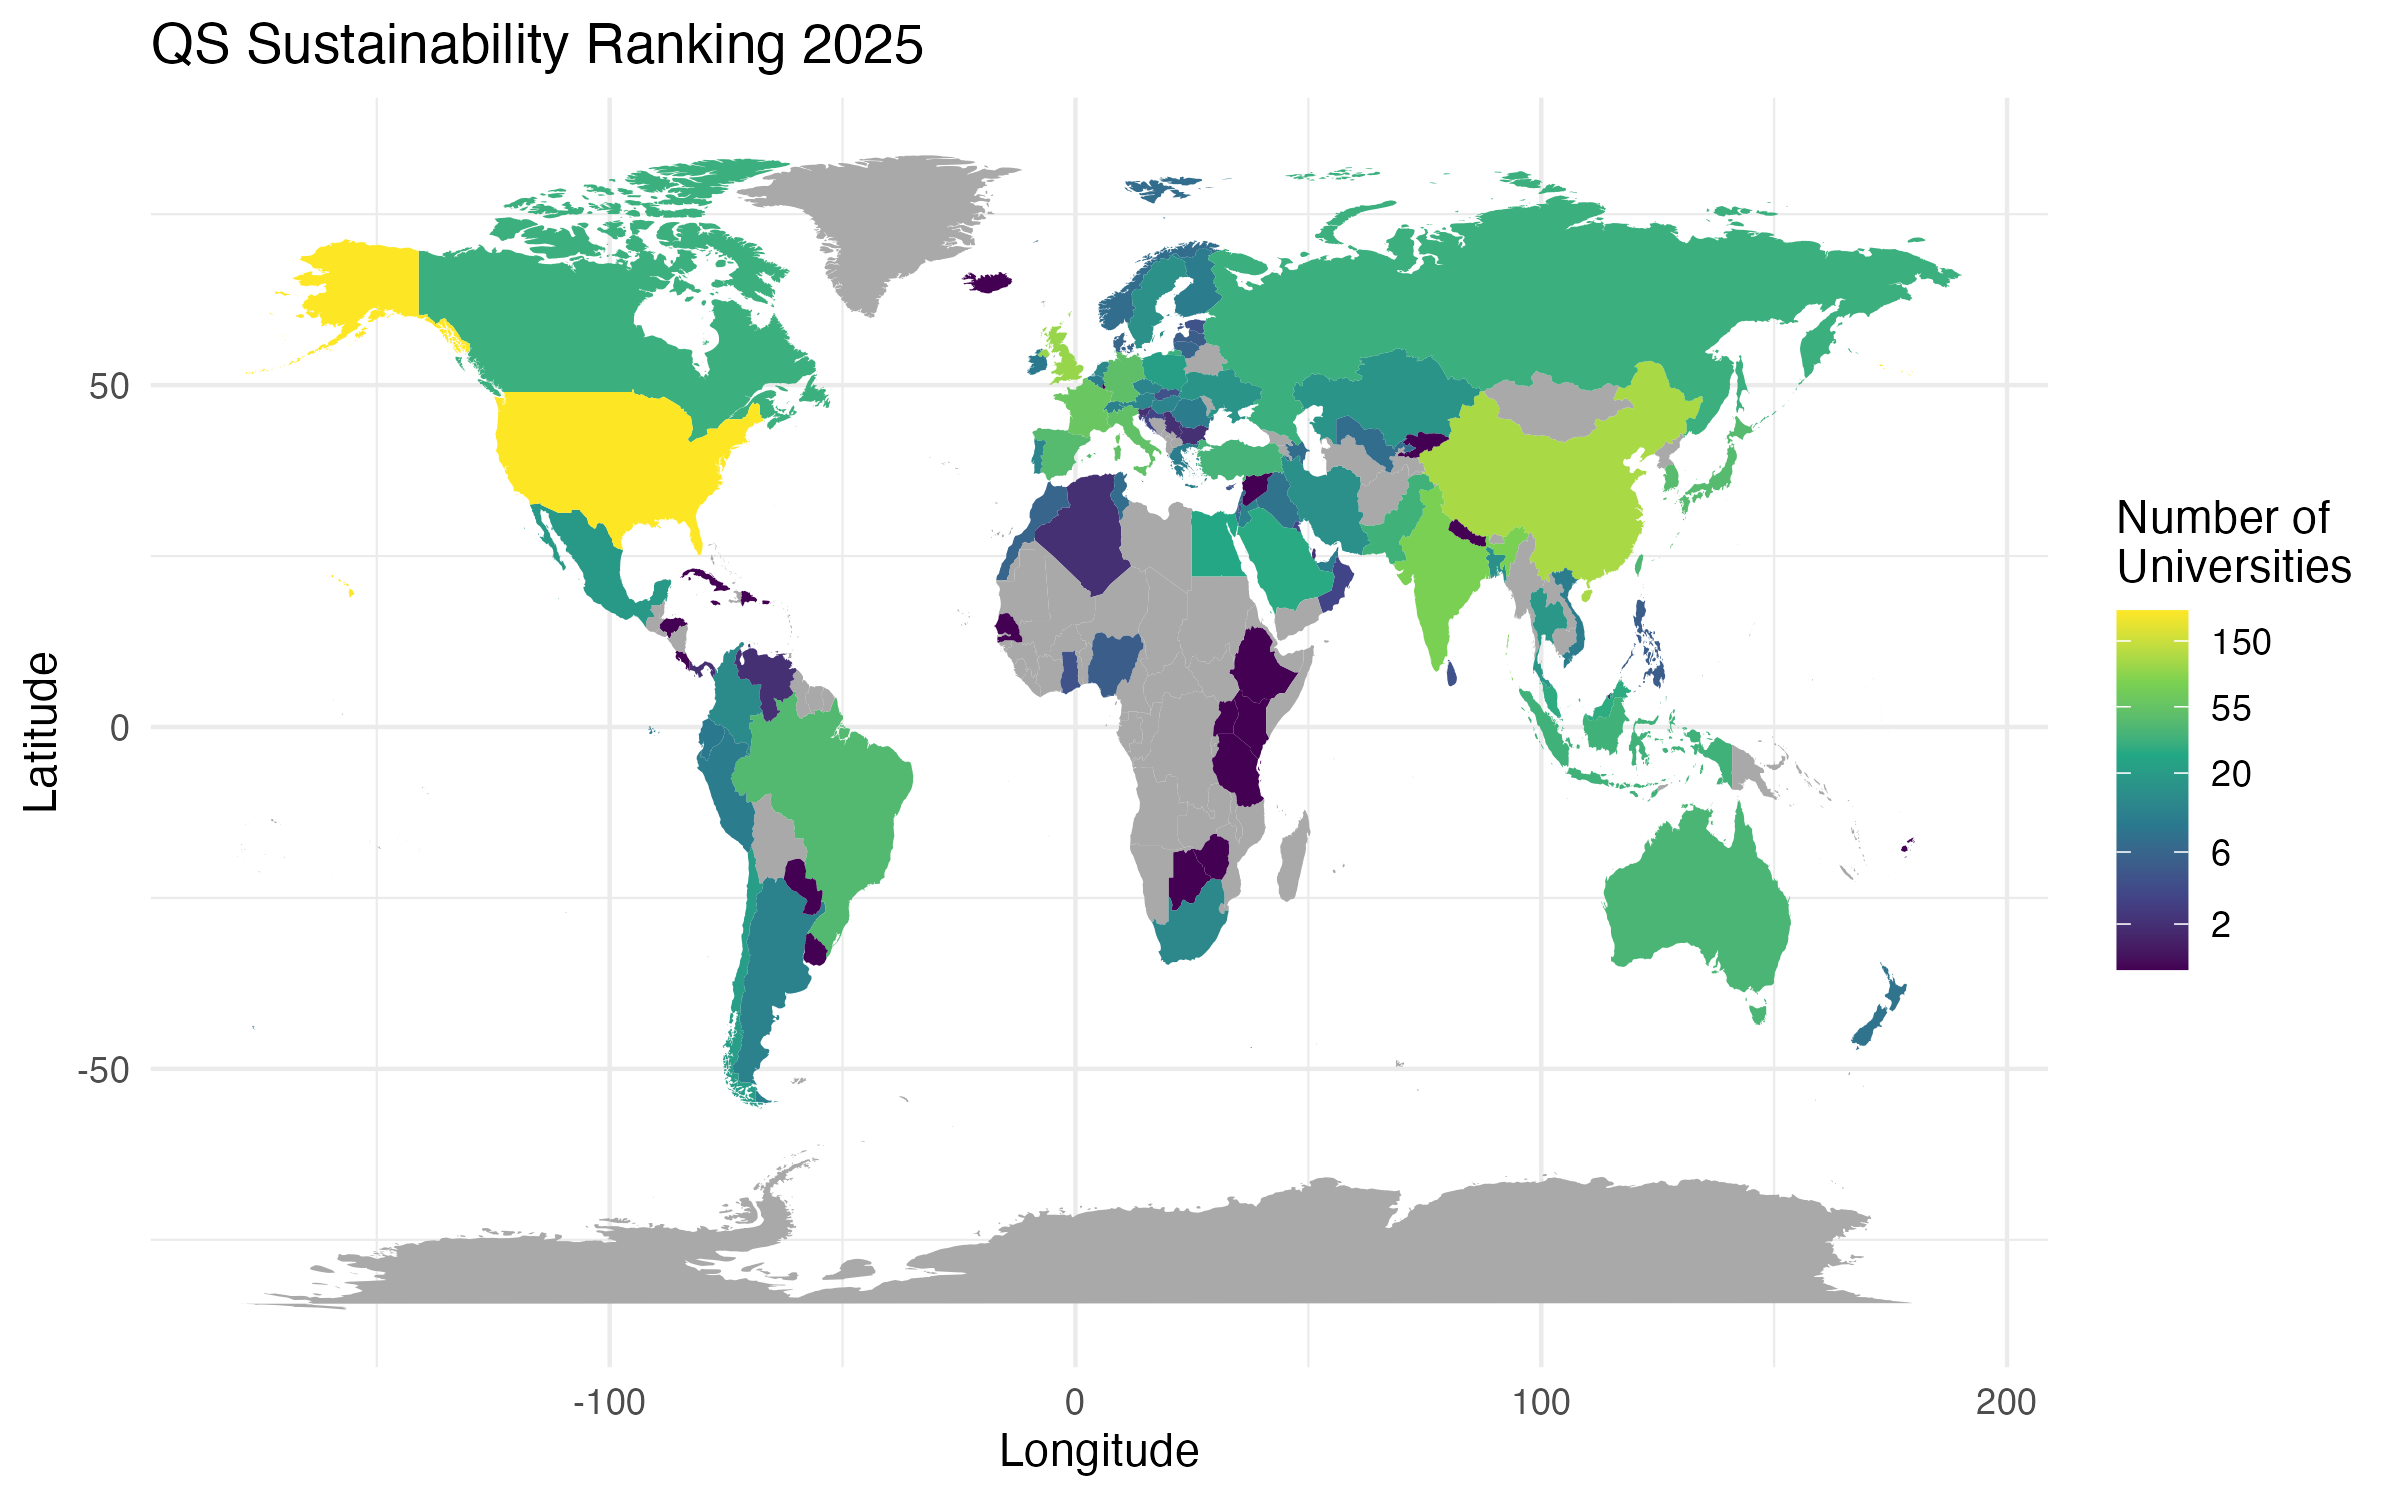
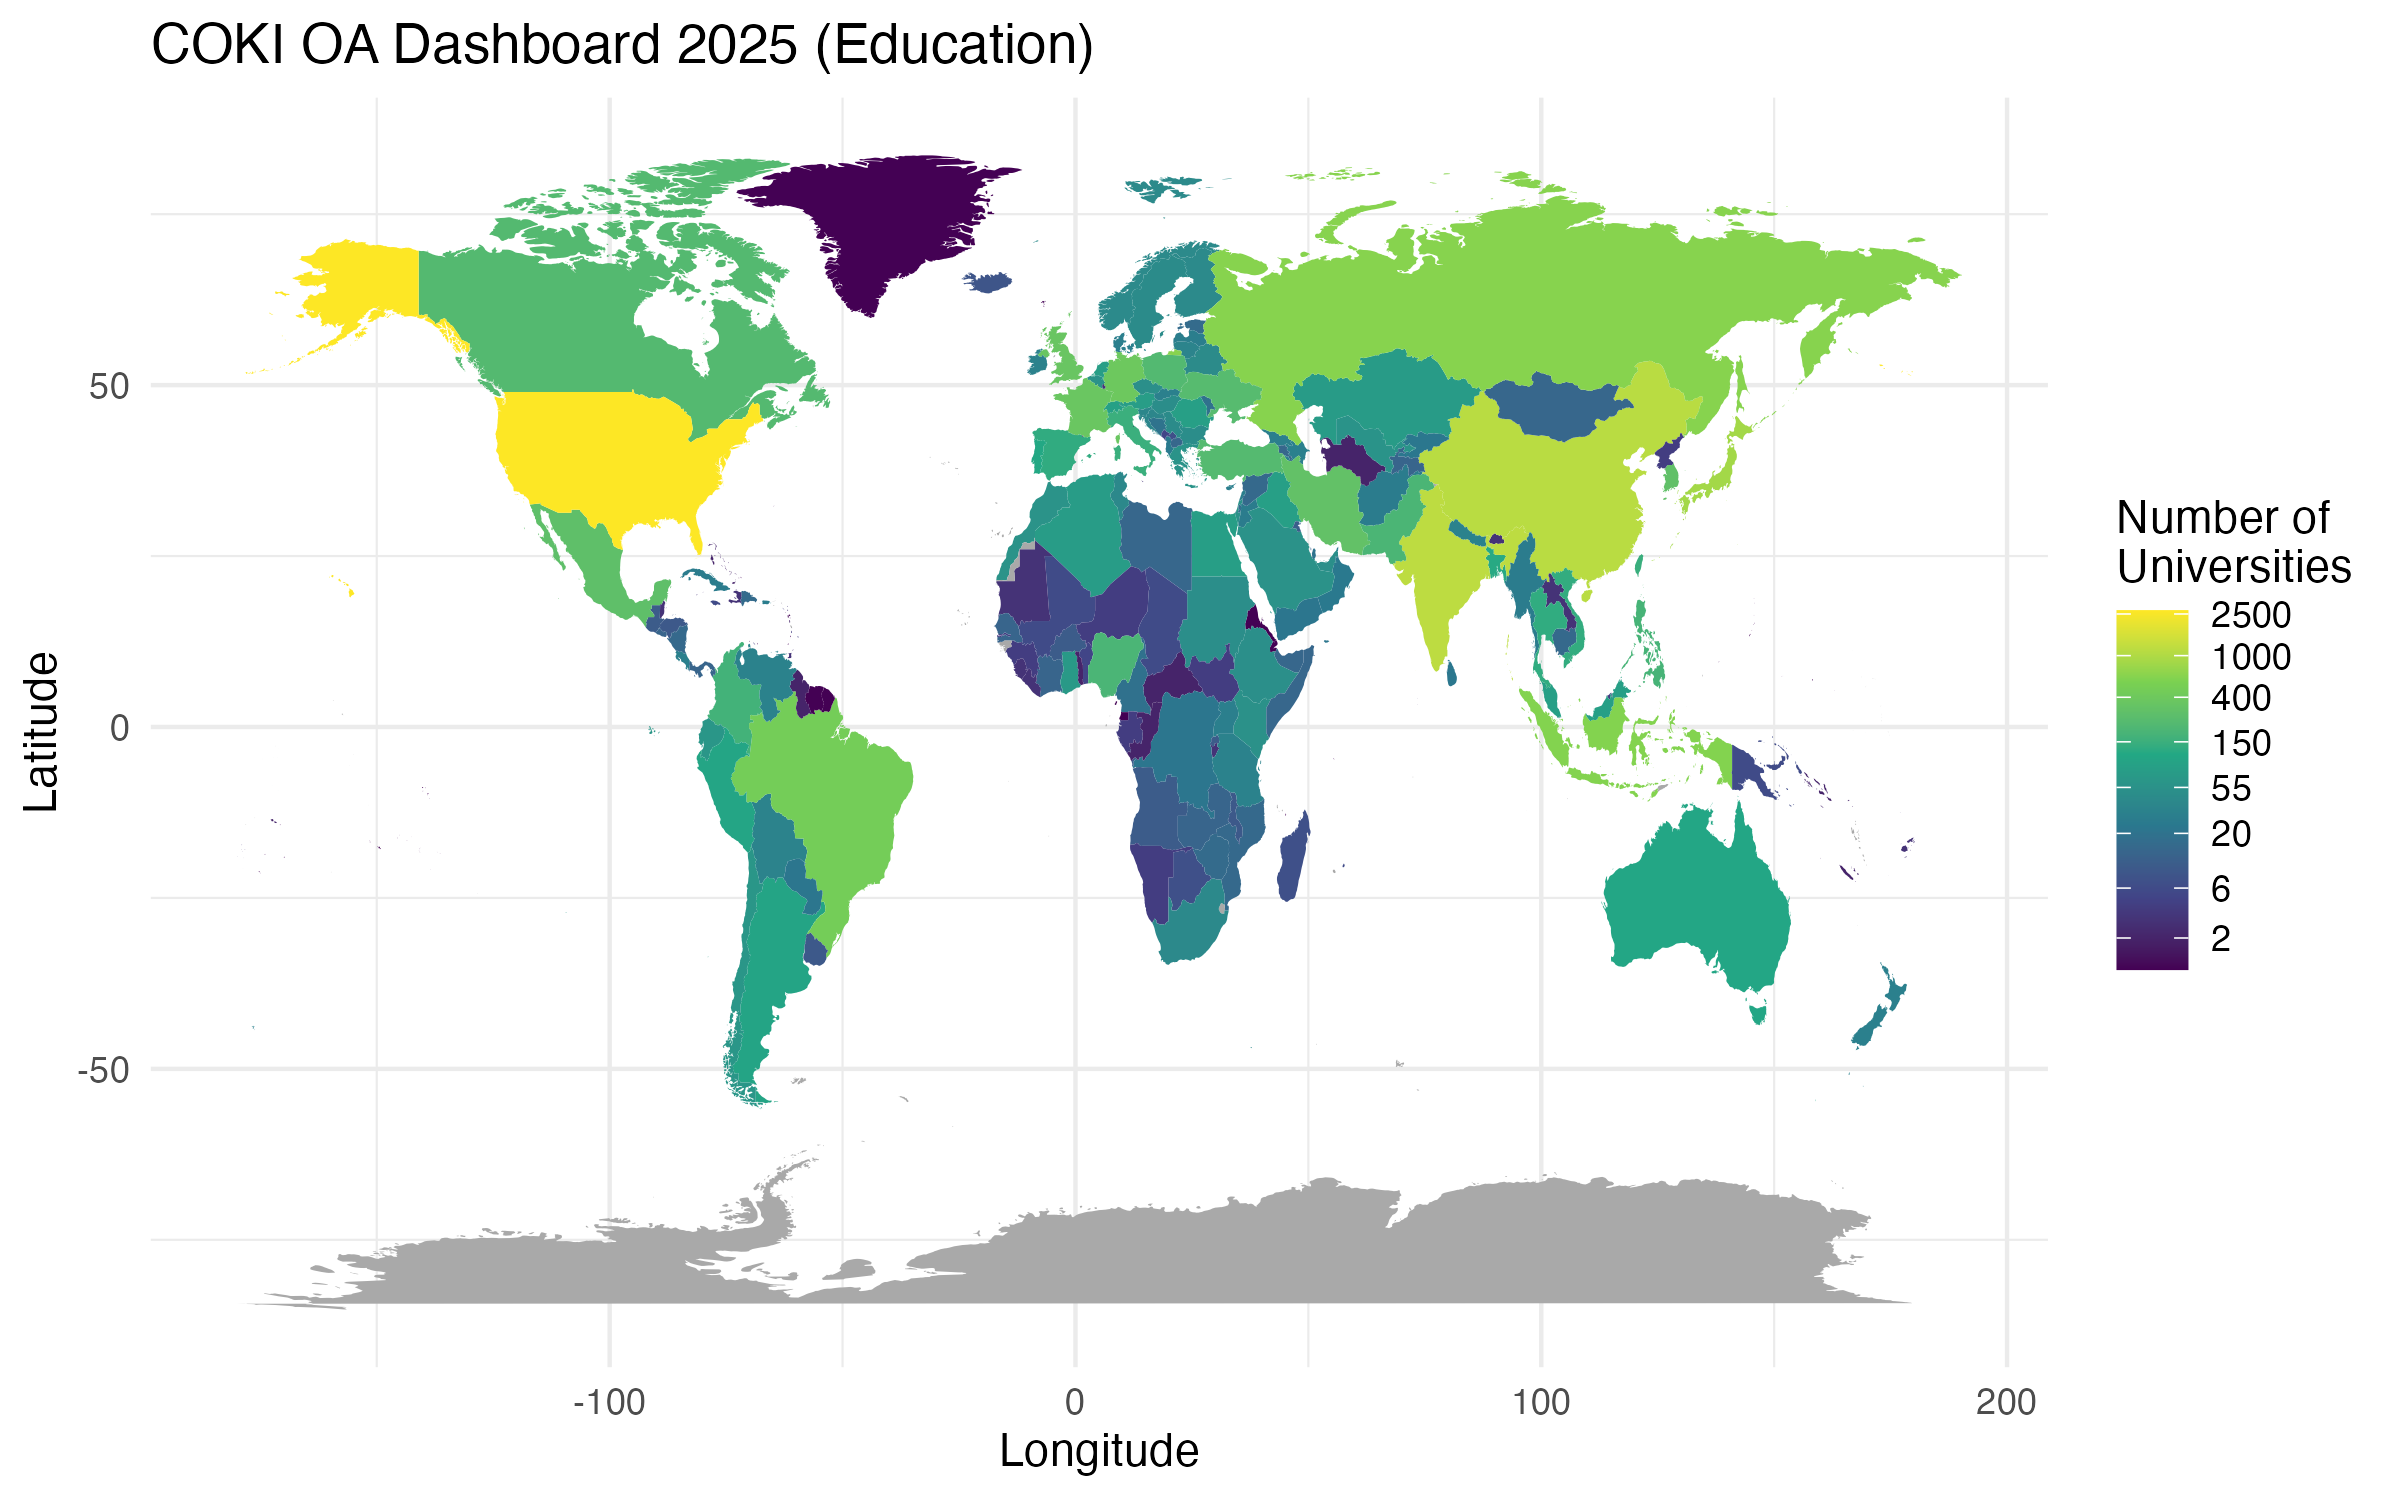
If we consider the absolute numbers of universities, Figures 4 and 5 show that for both versions of the Leiden Ranking and the SCImago Institutions Ranking, the majority of universities are located in China (LR: 313 institutions, LROE: 313 institutions, SIR: 634 institutions). In contrast, for the QS Sustainability Ranking and the COKI OA Dashboard, the majority of institutions are located in the United States of America (QS: 238 institutions, COKI: 2688 institutions). Furthermore, the figures illustrate that, with the exception of the COKI OA Dashboard, several countries in the global South are not represented in the ranking systems.
In addition to the absolute number of universities, the relative distribution of universities across countries and ranking systems is examined using the preference metric according to Moed (2016). Moed (2016) defines preference as follows4:
The preference of ranking system R for a particular country C is expressed as the ratio of the actual and the expected number of institutions from C appearing in R, where the expected number is based on the total number of institutions across countries and across systems, under the assumption of independence of these two variables. A value of 1.0 indicates that the number of institutions from C in R is ‘as expected’.
The resulting preference score (preference score) measures whether a country, measured by the number of institutions it hosts, is overrepresented or underrepresented in a ranking system relative to expectations. The metric is neutral at a value of 1.0, meaning the number of institutions from a country in a ranking system matches expectations. Values above 1.0 indicate that more institutions from a country are included in a ranking system than expected. Values below 1.0 indicate that fewer institutions from a country are included in a ranking system than expected.
Table 3 presents, for all five ranking systems, the top 5 countries based on preference score, as well as Germany, showing the absolute number of universities and the respective preference score.
| Ranking | Country | No. Universities | preference score |
|---|---|---|---|
| Leiden | Luxembourg | 1 | 2,45 |
| Australia | 35 | 2,34 | |
| Spain | 47 | 2,32 | |
| Italy | 49 | 2,22 | |
| China | 313 | 2,15 | |
| Germany | 57 | 1,46 | |
| SIR | Faroe Islands | 1 | 2,55 |
| French Guiana | 1 | 2,55 | |
| Grenada | 1 | 2,55 | |
| Guadeloupe | 1 | 2,55 | |
| Lesotho | 1 | 2,55 | |
| Germany | 108 | 0,82 | |
| COKI | Myanmar | 27 | 1,61 |
| Cambodia | 15 | 1,61 | |
| Nicaragua | 15 | 1,61 | |
| Somalia | 14 | 1,61 | |
| El Salvador | 13 | 1,61 | |
| Germany | 397 | 0,96 |
| Ranking | Land | Nr. Hochschulen | preference score |
|---|---|---|---|
| Leiden OE | Luxembourg | 1 | 2,45 |
| Australia | 35 | 2,34 | |
| Spain | 47 | 2,32 | |
| Italy | 49 | 2,22 | |
| China | 313 | 2,15 | |
| Germany | 57 | 1,46 | |
| QS | Brunei | 2 | 3,70 |
| Hong Kong | 9 | 3,17 | |
| Malta | 1 | 2,96 | |
| Saudi Arabia | 28 | 2,67 | |
| Jordan | 11 | 2,50 | |
| Germany | 50 | 1,11 |
Table 3 shows different geographical coverage of the various ranking systems in terms of overproportionally represented countries. Both versions of the Leiden Ranking tend to focus on Europe, the SCImago Institutions Ranking on North and South America, the COKI OA Dashboard predominantly on Asia and Central America, and the QS Sustainability Ranking primarily on Asia. A particular feature of the COKI OA Dashboard is that 68 countries have the same preference score of 1.61. The countries shown in Table 3 are the first five entries resulting from a descending sort by the number of institutions from the respective countries. The observation that a large number of countries share the same preference score is due to the fact that the 68 countries are exclusively included in the COKI OA Dashboard.
With regard to Germany, Table 3 shows that both versions of the Leiden Ranking and the QS Sustainability Ranking include a slightly overrepresented to overrepresented number of German universities, with preference scores of 1.46 and 1.11, respectively. This suggests that these ranking systems include a slightly higher to higher-than-expected number of German universities, with an absolute number of 50 and 57 universities, respectively. In contrast, while the COKI OA Dashboard includes a significantly higher absolute number of German universities (397), its preference score of 0.96 indicates that this number is below the expected value. For the SCImago Institutions Ranking, the preference score for German universities is only 0.82, indicating that German institutions are underrepresented in this ranking, even though the absolute number of German universities (108) is the second highest.
Institutional Participation in Data Collection
This section examines the data collection procedures of the various ranking providers and investigates the extent to which institutions can participate in the data collection process relevant to them.
For the traditional Leiden Ranking, the CWTS does not collect any data directly from the ranked institutions (Centre for Science and Technology Studies, Leiden University, n.d.-a, n.d.-c). The ranking is based on data from the Web of Science, which is processed and standardized by the CWTS. Since the Web of Science is a proprietary data source with licensing restrictions, the CWTS is unable to make the raw and curated data openly accessible (van Eck, Visser, et al., 2024). As a result, it is not straightforward for the institutions concerned to verify the data quality.
For the Leiden Ranking Open Edition, no data is collected directly from the institutions either (Centre for Science and Technology Studies, Leiden University, n.d.-b). In contrast to the traditional Leiden Ranking, however, the Leiden Ranking Open Edition relies on open data sources, such as OpenAlex and ROR, for the creation of the ranking (Centre for Science and Technology Studies, Leiden University, n.d.-b). Due to the use of open data sources and the CWTS’s provision of raw and results data (Centre for Science and Technology Studies, Leiden University, n.d.-d), it is possible for the ranked institutions to verify the data quality and participate in the data curation process by reporting issues with data quality to the respective actors.
The methodology of the SCImago Institutions Ranking describes that data is collected from various sources: Scopus, PATSTAT, Google, Semrush, Unpaywall, PlumX Metrics, Mendeley, and Overton (SCImago Research Group, n.d.-a). The methodology does not mention any possibility of institutional participation in the data collection process, so it is assumed that no data is collected directly from the ranked institutions. The bibliographic data for the SCImago Institutions Ranking comes from Scopus, a proprietary data source with licensing restrictions, similar to the Web of Science. The raw data from the SCImago Institutions Ranking is not publicly accessible, so it is assumed that ranked institutions are not easily able to verify or correct the data concerning them before they are included in the ranking. For determining the Open Access status, the SCImago Institutions Ranking uses Unpaywall, an open data source. Similar to the Leiden Ranking Open Edition, this could allow institutions to participate in the data curation process by reporting data quality issues directly to Unpaywall. Overall, however, the methodology of the SCImago Institutions Ranking provides little information regarding data quality and potential limitations, nor does it transparently communicate the opportunities for institutions to contribute to improved data quality.
The COKI Open Access Dashboard uses only open data sources for data collection, including Crossref, Unpaywall, and ROR (Curtin Open Knowledge Initiative, n.d.-c). The methodology of the COKI OA Dashboard describes the process of data collection from external sources in detail (Curtin Open Knowledge Initiative, n.d.-c) but does not provide any information about data submission by the ranked institutions themselves. Therefore, it is assumed that there is no direct institutional participation in the data collection process. Since the COKI dataset is based on open data sources, similar to the Leiden Ranking Open Edition, it is assumed that the institutions concerned can indirectly participate in the data curation process by reporting data quality issues directly to the various data sources. Additionally, COKI communicates limitations of its dataset (Curtin Open Knowledge Initiative, n.d.-c) and offers various contact options (Curtin Open Knowledge Initiative, n.d.-a), so institutions also have the opportunity to actively contribute to improving the quality of the COKI dataset.
The QS Sustainability Ranking is the only one of the five analyzed ranking systems that provides for direct participation of the institutions concerned in the data collection process. The methodology of the QS Sustainability Ranking describes that QS generally encourages all institutions to provide data for the QS Rankings (Quacquarelli Symonds, n.d.-f). For data submission, QS provides a special platform, but the methodology does not offer a precise list of the data requested (Quacquarelli Symonds, n.d.-f). If institutions that qualify for inclusion in the QS Sustainability Ranking do not provide data, QS evaluates these institutions based on proprietary and publicly available data or data previously submitted by the respective institution. A complete opt-out of the ranking by the institution is not provided for. QS argues that the inclusion of all qualifying institutions increases the reliability of the rankings (Quacquarelli Symonds, n.d.-b). However, QS does not provide information on how many of the ranked institutions actually take the opportunity to submit data.
Overall, it is evident that the opportunity for institutions to participate in the data collection process of the ranking providers is limited. The QS Sustainability Ranking is the only ranking system that directly collects data from the institutions concerned, although it is not entirely clear which specific data is requested from the institutions. The other ranking systems use data exclusively from external sources that are not directly collected from the institutions. The use of open data sources, as in the Leiden Ranking Open Edition or the COKI OA Dashboard, can, however, provide institutions with an opportunity to improve the quality of the data concerning them. High-quality source data and transparent methodologies for creating rankings can further contribute to improving trust in the reliability and validity of the ranking systems.
References
Footnotes
Information on the availability of data, including a link to download the version of the data used (if available), is provided for all rankings in the respective “Ranking Details” section.↩︎
For example, in the SCImago Institutions Ranking, the Deutsche Krebsforschungszentrum is listed in the national language, while in ROR, the English name German Cancer Research Center is used as the primary designation.↩︎
Clicking on the figures enlarges them for better viewing.↩︎
Formally, Moed (2016) defines preference as: \(P= \dfrac{\bigg(\dfrac{n[i, j]}{\sum_i n[i, j]}\bigg)}{\bigg(\dfrac{\sum_jn[i, j]}{\sum_i\sum_jn[i, j]}\bigg)}\), where \(n[i, j]\) represents the number of institutions from country \(i\) in ranking system \(j\), \(\sum_in[i, j]\) is the sum of all \(n[i, j]\) across all \(i\) (countries), \(\sum_jn[i, j]\) is the sum of all \(n[i, j]\) across all \(j\) (ranking systems), and \(\sum_i\sum_jn[i, j]\) is the sum of all \(n[i, j]\) across all \(i\) (countries) and all \(j\) (ranking systems).↩︎