Open Access Cost Monitoring with OpenAPC
Dorothea Strecker 
This notebook is a tool for library and information professionals dealing with cost monitoring in terms of Open Access publication output at their institution. It shows how to leverage the OpenAPC data set to collect and analyze cost information using R. No software installation or prior programming knowledge required. At the end of the notebook you will find some short excercises that can be executed directly in your browser. If you have suggestions or notice any mistake, please open an issue.
Dieses Notebook wird nur auf Englisch angeboten
What is OpenAPC?
OpenAPC is an initiative that aims to collect information on payments for open access publications (Pieper and Broschinski 2018). The project is located at Bielefeld University Library and started ingesting data from research organizations in 2014. Although the project initially started with a focus on Germany, institutions from more than 20 countries share payment information via OpenAPC as of 2025.
If research organizations are pursuing a complete transition away from the subscription model and toward open access, it is important to understand the financial dimension. However, data on open access costs are difficult to obtain. Prices listed on publisher websites can be useful to understand what publishers charge for open access publications. There are lists that collect this information and enable comprehensive analyses across multiple publishers (Butler et al. 2024). In contrast to these price lists, OpenAPC collects information about payments research organizations made. The amounts paid can differ from prices listed on publisher websites, for example if the organization has signed an agreement with the publisher, or if a publisher grants a discount.
The OpenAPC dataset shows how much money was spent to publish open access. The initiators imagine that the dataset “[can] be reused to make cash flows between research institutions and publishers more transparent.” (OpenAPC, n.d.)
Participating in OpenAPC is voluntary. Not all institutions collect data about these payments or pass the data on to OpenAPC.
How can I access OpenAPC data?
OpenAPC offers three main ways to access the data:
The GitHub repository
The project is organized in a GitHub repository. You can find and download csv-files with payment information for individual institutions in the folder data.
The OLAP server
The OLAP server allows programmatic access to and retrieval of OpenAPC data.
The Dashboard
On the dashboard, you are able to filter the dataset, see a treemap visualization and download data.
Exploring OpenAPC data
In this notebook we will look at OpenAPC data with R (R Core Team 2025), using a specific research organization as an example (Charité - Universitätsmedizin Berlin). We want to adress the following questions:
- How much did the institution spend on open access publications in total?
- How are payments distributed across journals and publishers?
- How do payments evolve over the years?
To answer the questions, we have retrieved APC data for Charité - Universitätsmedizin Berlin from the OpenAPC dashboard.
OpenAPC offers comprehensive information on APC payments for participating research organizations. For a full documentation of all available fields, please refer to the OpenAPC schema.
loading packages
We will load the dplyr (Wickham et al. 2023) and tidyr (Wickham et al. 2024) packages that provide a lot of additional functionalities for data wrangling, and ggplot2 (Wickham 2016) for data visualization. All three packages are part of the tidyverse package (Wickham et al. 2019).
loading data
We will load the csv file downloaded from the OpenAPC dashboard and store it in the object df.
df <- read.csv("notebooks/facts.csv")structure of the dataset
To get an overview of the structure of our data frame, especially the number of rows (observations) and columns (variables), the individual column names and the data types they contain, we will use the glimpse function from the dplyr package.
dplyr::glimpse(df)Rows: 4,331
Columns: 10
$ X__fact_key__ <chr> "Charité - Universitätsmedizin Berlin", "Charité - …
$ institution <chr> "Charité - Universitätsmedizin Berlin", "Charité - …
$ period <int> 2019, 2019, 2019, 2019, 2019, 2019, 2019, 2019, 201…
$ publisher <chr> "Wiley-Blackwell", "Wiley-Blackwell", "Wiley-Blackw…
$ journal_full_title <chr> "International Journal of Gynecology & Obstetrics",…
$ issn <chr> "0020-7292", "0909-752X", "1552-4825", "0906-6705",…
$ doi <chr> "10.1002/ijgo.13099", "10.1111/srt.12800", "10.1002…
$ is_hybrid <lgl> TRUE, TRUE, TRUE, TRUE, TRUE, TRUE, TRUE, TRUE, TRU…
$ country <chr> "DEU", "DEU", "DEU", "DEU", "DEU", "DEU", "DEU", "D…
$ euro <dbl> 4331.07, 4331.07, 4331.07, 4331.07, 4331.07, 4331.0…The output shows that our data frame contains a total of 4,331 rows (observations) and 10 columns. Each row in the data frame corresponds to one APC payment. The output also shows that most of the column values are of data type character (chr), the period column values are of type integer (int), the is_hybrid column values are of type logical (lgl) and the euro column values are of type double-precision floating-point (dbl) - a format for decimal numbers. The output also indicates the first values of every column on the right hand side.
To look at the first 10 rows of our data frame we are using the head function.
head(df, 10) X__fact_key__ institution
1 Charité - Universitätsmedizin Berlin Charité - Universitätsmedizin Berlin
2 Charité - Universitätsmedizin Berlin Charité - Universitätsmedizin Berlin
3 Charité - Universitätsmedizin Berlin Charité - Universitätsmedizin Berlin
4 Charité - Universitätsmedizin Berlin Charité - Universitätsmedizin Berlin
5 Charité - Universitätsmedizin Berlin Charité - Universitätsmedizin Berlin
6 Charité - Universitätsmedizin Berlin Charité - Universitätsmedizin Berlin
7 Charité - Universitätsmedizin Berlin Charité - Universitätsmedizin Berlin
8 Charité - Universitätsmedizin Berlin Charité - Universitätsmedizin Berlin
9 Charité - Universitätsmedizin Berlin Charité - Universitätsmedizin Berlin
10 Charité - Universitätsmedizin Berlin Charité - Universitätsmedizin Berlin
period publisher
1 2019 Wiley-Blackwell
2 2019 Wiley-Blackwell
3 2019 Wiley-Blackwell
4 2019 Wiley-Blackwell
5 2019 Wiley-Blackwell
6 2019 Wiley-Blackwell
7 2019 Wiley-Blackwell
8 2019 Wiley-Blackwell
9 2019 Wiley-Blackwell
10 2019 Wiley-Blackwell
journal_full_title issn
1 International Journal of Gynecology & Obstetrics 0020-7292
2 Skin Research and Technology 0909-752X
3 American Journal of Medical Genetics Part A 1552-4825
4 Experimental Dermatology 0906-6705
5 Journal of Internal Medicine 0954-6820
6 Immunology 0019-2805
7 JDDG Journal der Deutschen Dermatologischen Gesellschaft 1610-0379
8 Allergy 0105-4538
9 Journal of Tissue Engineering and Regenerative Medicine 1932-6254
10 Alcoholism Clinical and Experimental Research 0145-6008
doi is_hybrid country euro
1 10.1002/ijgo.13099 TRUE DEU 4331.07
2 10.1111/srt.12800 TRUE DEU 4331.07
3 10.1002/ajmg.a.61419 TRUE DEU 4331.07
4 10.1111/exd.14007 TRUE DEU 4331.07
5 10.1111/joim.12985 TRUE DEU 4331.07
6 10.1111/imm.13138 TRUE DEU 4331.07
7 10.1111/ddg.14013 TRUE DEU 4331.07
8 10.1111/all.14015 TRUE DEU 4331.07
9 10.1002/term.2948 TRUE DEU 4331.07
10 10.1111/acer.14211 TRUE DEU 4331.07The first argument within the head function is our data frame df and the second argument is the number of rows we want to have returned. Each row within our data frame corresponds to an article.
Analyzing and visualizing open access payments
In the following sections, we will analyze the data to address our questions and generate visualizations.
How much did the institution spend on open access publications in total?
To determine total open access spending of the research organization, we are using the sum function and apply it to the colum euro. The OpenAPC schema states that this column contains “[t]he APC amount that was paid in EURO. Includes VAT and any discounts”.
sum(df$euro)[1] 8669107Without context, this number does not say much. Applying the min and max functions to the column period (“Year of APC payment (YYYY)”), we can see that this sum was accrued over a period of 6 years, from 2018 to 2023.
Because it takes research organizations time to collect and process data on APC payments and submit it to OpenAPC, there is usually a delay in reporting. In this example, data for 2024 is not yet available.
How are payments distributed across journals?
The R package dplyr provides a lot of functionality for data wrangling. We can’t go into much detail here, but we will demonstrate how to use some of the most useful functions.
One of them is the group_by function. Here, we use it to group the dataset by the column journal_full_title. This will allow us to generate aggregate statistics for articles published within a journal. We then use the pipe operator |>, which takes output from one function as input for the next function. The input is passed to the summarise function, where we calculate aggregate statistics. For each journal in the dataset, we calculate the total number of articles published (n_articles), the total of APCs paid (sum_apc), the average APC paid per article (avg_apc), and the standard deviation (sd_apc). The last two statistics are rounded to two decimal places. To get a better overview of the data, we then use arrange to sort the result by the total number of articles.
# A tibble: 923 × 5
   journal_full_title                          n_articles sum_apc avg_apc sd_apc
   <chr>                                            <int>   <dbl>   <dbl>  <dbl>
 1 Scientific Reports                                 232 433492.   1868.   141.
 2 PLOS ONE                                           134 223456.   1668.   210.
 3 Frontiers in Immunology                            130 276129.   2124.   516.
 4 International Journal of Molecular Sciences        124 222282.   1793.   331.
 5 Journal of Clinical Medicine                       120 212463.   1771.   502.
 6 Frontiers in Neurology                              70 144595.   2066.   558.
 7 Cancers                                             66 118423.   1794.   557.
 8 Allergy                                             61 168277.   2759.   623.
 9 Frontiers in Psychiatry                             60 128626.   2144.   638.
10 Frontiers in Physiology                             43  91332    2124    474.
# ℹ 913 more rows
The results show that Charité paid APCs for 923 journals, as indicated by the number of rows. Most APC payments were made to the journals Scientific Reports, PLOS ONE, and Frontiers in Immunology. The column sd_apc tells us that for some journals, there is a considerable variance in APC payments.
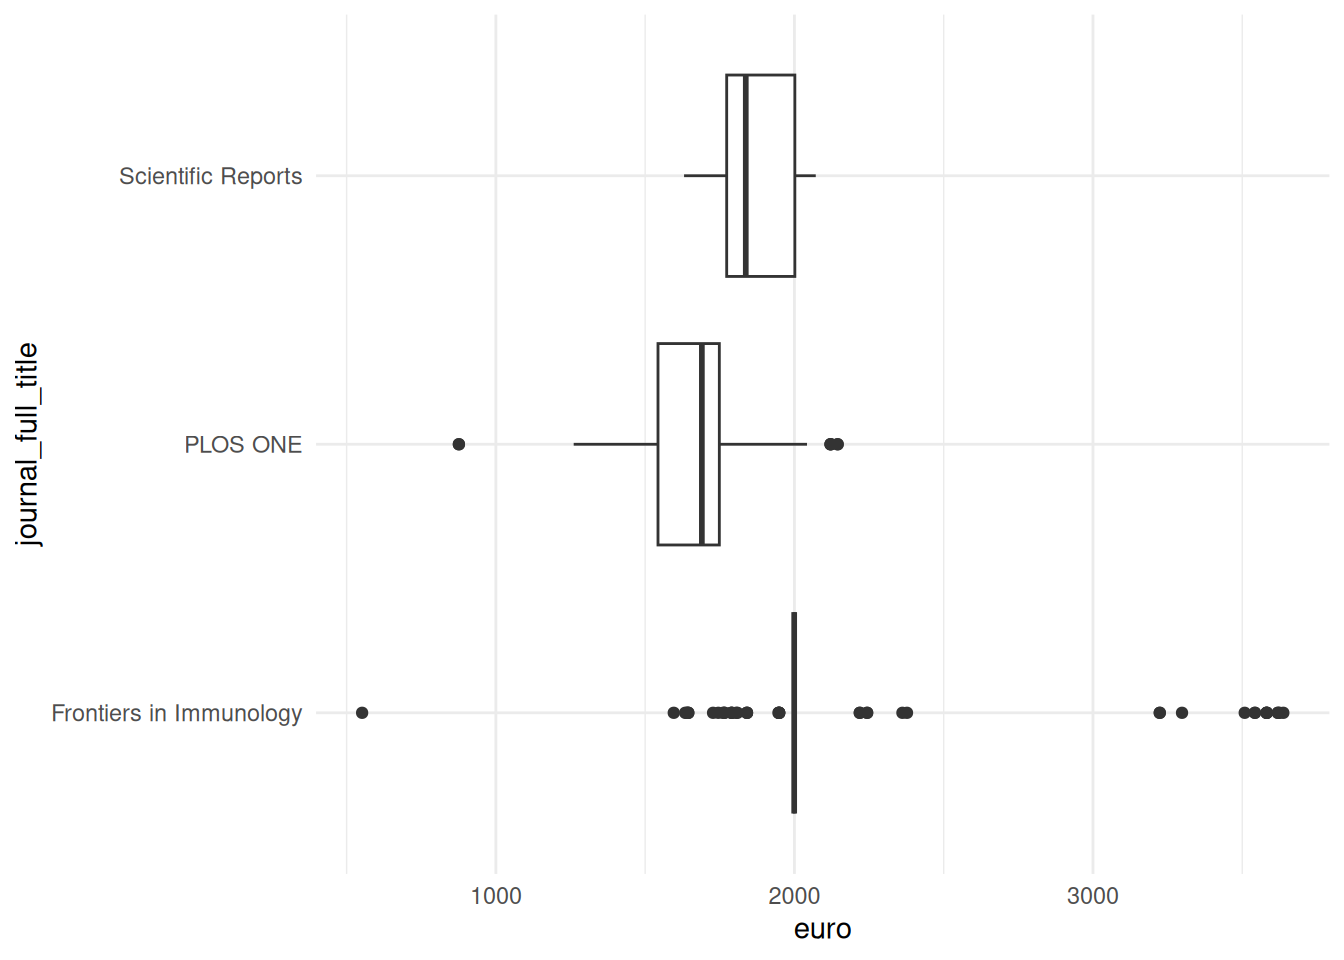
We can explore this variance further by visualizing the distribution of APC payments. For this, we will use the packages dplyr and ggplot2. First, we filter the data to focus on the three journals with the most APC payments. We then pass this output to the ggplot function. We assign the column euro to the x axis and the column journal_full_title to the y axis. Next, we define the type of plot we want - here, we choose a box plot to visualize a distribution. Finally, we choose the theme theme_minimal for a simple layout.
df |>
  dplyr::filter(journal_full_title %in% c("Scientific Reports", "PLOS ONE", "Frontiers in Immunology")) |>
  ggplot(aes(x = euro, y = journal_full_title)) +
  geom_boxplot() +
  theme_minimal()
These box plots show clear differences in the distribution of APC payments. The three journals differ in the median amount of APCs paid - the median is the middle point in a distribution and is visualized by the vertical line in the box plot. We also see that the range of APC payments is highest for Frontiers in Immunology: there are outliers at the bottom and top end of the distribution, as indicated by the dots.
How do payments evolve over the years?
We can combine dplyr and ggplot2 to visualize the development of APC payments over time. We will also consider open access types (gold / hybrid).
First, we group the data by period (“Year of APC payment (YYYY)”) and is_hybrid (“Determines if the article has been published in a hybrid journal (TRUE) or in fully/Gold OA journal (FALSE)”). Just like above, we will generate the aggregate statistic n_articles. In the ggplot function, we assign the column period to the x axis, n_articles to the y axis, and is_hybrid to fill - this means that different colours will be assigned to the open access types. We choose the graph type geom_col, a simple bar chart.
The plot tells us that the number of APC payments has increased between 2018 and 2021 and has dropped off since. We can also see that APC payments for publications in hybrid open access journals have increased considerably between 2019 and 2020. This is likely the result of transformative agreements between German research organizations and publishers.
Exercises
The following exercises focus on APC payments to publishers and include interactive code blocks. You can adapt the code and run it by clicking on run code.
1. Aggregate statistics for publishers
Above, we analyzed APC payments by journal. Here is a copy of that code block. See if you can adapt it to give you aggregate statistics for publishers instead.
Which publishers received the highest amount of APC payments from Charité? Do you notice any interesting patterns?
2. Visualization of APC distribution by publisher
Now, see if you can adapt the code above to show you the distribution of APC payments by publisher.